
![]()


![]()
![]()
![]()
![]()
![]()
Oceans and seas significantly impact continental weather, with evaporation from the sea surface driving cloud formation and precipitation. Tropical cyclones, warm-core low-pressure systems, form over warm oceans where temperatures exceed 26°C, precipitated by the release of latent heat from condensation. These cyclones, known by various names depending on the region, have organised circulations and develop primarily in tropical and subtropical waters, except in regions with cooler sea surface temperatures and high vertical wind shears. They reach peak intensity over warm tropical waters and weaken upon landfall, often causing extensive damage before dissipating.
The Philippines frequently experiences tropical cyclones (called bagyo - pronounced /baɡˈjo/, [bɐɡˈjo] - in the Filipino language) because of its geographical position. These cyclones typically bring heavy rainfall, leading to widespread flooding, as well as strong winds that cause significant damage to human life, crops, and property. Data on cyclones are collected and curated by the Philippine Atmospheric, Geophysical, and Astronomical Services Administration (PAGASA).
This package contains Philippine tropical cyclones data from 2017 to
2022 in a machine-readable format. It is hoped that this data package
provides an interesting and unique dataset for data exploration and
visualisation as an adjunct to the traditional iris
dataset and to the current palmerpenguins
dataset.
You can install bagyo from CRAN with:
install.packages("bagyo")You can install the development version of bagyo from GitHub using
pak with:
## Install pak as needed ----
## install.packages("pak")
pak::pak("panukatan/bagyo")
You can also install bagyo from the panukatan R Universe
with:
install.packages(
  "bagyo",
  repos = c('https://panukatan.r-universe.dev', 'https://cloud.r-project.org')
)
Once the bagyo package has been installed, the
bagyo dataset can be loaded into R as follows:
library(bagyo)
data(package = "bagyo")

bagyo
#> # A tibble: 119 × 9
#>     year category_code category_name         name  rsmc_name start
#>    <dbl> <fct>         <fct>                 <chr> <chr>     <dttm>
#>  1  2017 TD            Tropical Depression   Auri… <NA>      2017-01-07 08:00:00
#>  2  2017 TD            Tropical Depression   Bisi… <NA>      2017-02-03 14:00:00
#>  3  2017 TD            Tropical Depression   Cris… <NA>      2017-04-14 14:00:00
#>  4  2017 TS            Tropical Storm        Dante Muifa     2017-04-26 08:00:00
#>  5  2017 STS           Severe Tropical Storm Emong Nanmadol  2017-07-02 02:00:00
#>  6  2017 TD            Tropical Depression   Fabi… Roke      2017-07-22 02:00:00
#>  7  2017 TY            Typhoon               Gorio Nesat     2017-07-25 14:00:00
#>  8  2017 TS            Tropical Storm        Huan… Haitang   2017-07-30 02:00:00
#>  9  2017 STS           Severe Tropical Storm Isang Hato      2017-08-20 08:00:00
#> 10  2017 TS            Tropical Storm        Joli… Pakhar    2017-08-24 14:00:00
#> # ℹ 109 more rows
#> # ℹ 3 more variables: end <dttm>, pressure <int>, speed <int>bagyo is
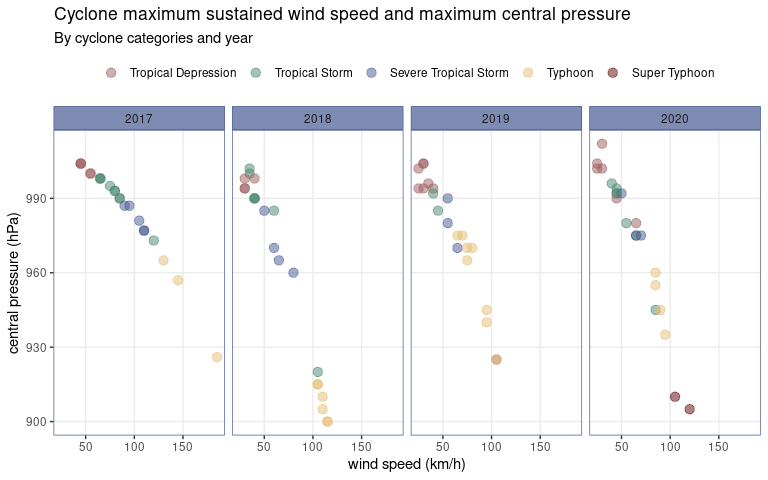
interesting to summariselibrary(dplyr)
## Get cyclone category mean pressure and speed ----
bagyo |>
group_by(category_name) |>
summarise(
n = n(),
mean_pressure = mean(pressure),
mean_speed = mean(speed)
)
#> # A tibble: 5 × 4
#> category_name n mean_pressure mean_speed
#> <fct> <int> <dbl> <dbl>
#> 1 Tropical Depression 32 995. 39.1
#> 2 Tropical Storm 33 988. 56.8
#> 3 Severe Tropical Storm 20 978. 71.8
#> 4 Typhoon 26 944. 97.7
#> 5 Super Typhoon 8 911. 110bagyo
is useful in learning how to work with dates## Get cyclone category mean duration (in hours) ----
bagyo |>
mutate(duration = end - start) |>
group_by(category_name) |>
summarise(mean_duration = mean(duration))
#> # A tibble: 5 × 2
#> category_name mean_duration
#> <fct> <drtn>
#> 1 Tropical Depression 46.01562 hours
#> 2 Tropical Storm 60.36364 hours
#> 3 Severe Tropical Storm 80.58333 hours
#> 4 Typhoon 105.37821 hours
#> 5 Super Typhoon 97.06250 hoursbagyo is great to
visualise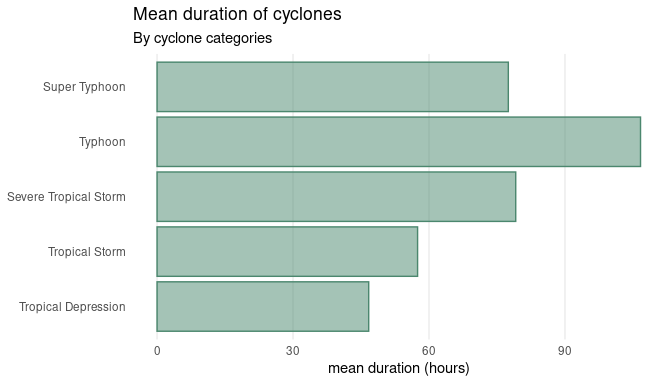
To cite bagyo in your work, please use the citation
provided by a call to the citation() function as
follows:
citation("bagyo")
#> To cite bagyo in publications use:
#>
#>   Ernest Guevarra (2026). _bagyo: Philippine Tropical Cyclones Data_.
#>   doi:10.5281/zenodo.10972235
#>   <https://doi.org/10.5281/zenodo.10972235>, R package version 0.2.0,
#>   <https://panukatan.io/bagyo/>.
#>
#> A BibTeX entry for LaTeX users is
#>
#>   @Manual{,
#>     title = {bagyo: Philippine Tropical Cyclones Data},
#>     author = {{Ernest Guevarra}},
#>     year = {2026},
#>     note = {R package version 0.2.0},
#>     url = {https://panukatan.io/bagyo/},
#>     doi = {10.5281/zenodo.10972235},
#>   }
You can also use the citation provided by GitHub, generated from the information in the project’s CITATION.cff file.
Feedback, bug reports and feature requests are welcome; file issues or seek support here. If you would like to contribute to the package, please see our contributing guidelines.
This project is released with a Contributor Code of Conduct. By participating in this project you agree to abide by its terms.