Automatic Codebooks from Metadata Encoded in Dataset Attributes
Easily automate the following tasks to describe data frames: - summarise the distributions, and labelled missings of variables graphically and using descriptive statistics - for surveys, compute and summarise reliabilities (internal consistencies, retest, multilevel) for psychological scales, - combine this information with metadata (such as item labels and labelled values) that is derived from R attributes.
To do so, the package relies on ‘rmarkdown’ partials, so you can generate HTML, PDF, and Word documents. Codebooks are also available as tables (CSV, Excel, etc.) and in JSON-LD, so that search engines can find your data and index the metadata.
RStudio and a few of the tidyverse package already usefully display the information contained in the attributes of the variables in your data frame. The haven package also manages to grab variable documentation from SPSS or Stata files.
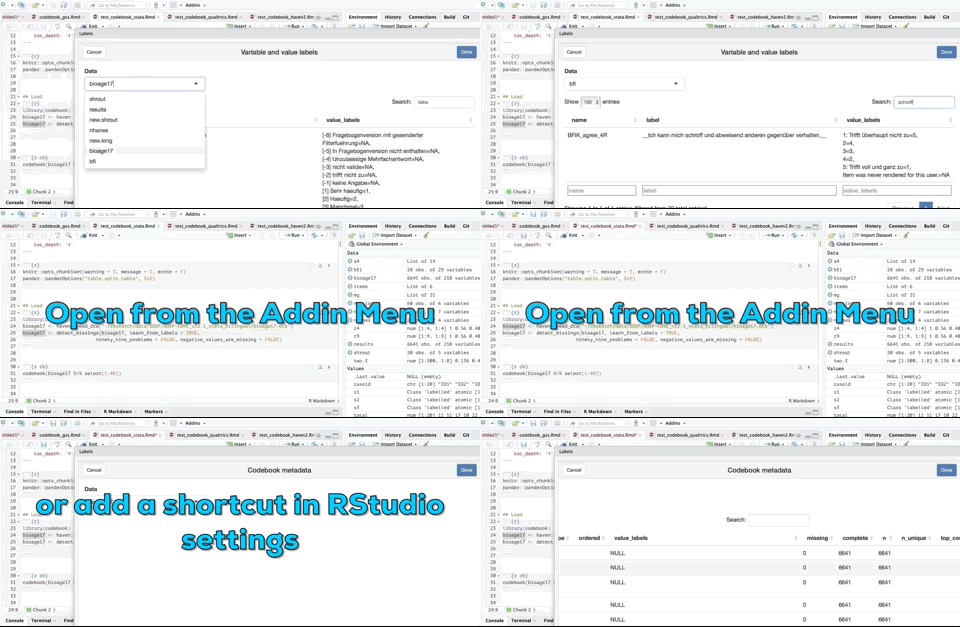
If the RStudio data viewer scrolls slow for your taste, or you’d like to keep the variable labels in view while working, use our RStudio Addins (ideally assigned to a keyboard shortcut) to see and search variable and value labels in the viewer pane.

The codebook package takes those attributes and the data and tries to produce a good-looking codebook, i.e. a place to get an overview of the variables in a dataset. The codebook processes single items, but also “scales”, i.e. psychological questionnaires that are aggregated to extract a construct. For scales, the appropriate reliability coefficients (internal consistencies for single measurements, retest reliabilities for repeated measurements, multilevel reliability for multilevel data) are computed. For items and scales, the distributions are summarised graphically and numerically.
This package integrates tightly with formr (formr.org), an online survey framework and especially the data frames produced and marked up by the formr R package. However, codebook is completely independent of it.
Confer the help or: https://rubenarslan.github.io/codebook/. See the vignette
for a quick example of an HTML document generated using
codebook, or below for a copy-pastable rmarkdown document
to get you started.
If you don’t want to install the codebook package, you can just upload an annotated dataset in a variety of formats (R, SPSS, Stata, …) here: https://codebook.formr.org
Run the following in R.
install.packages("codebook")Or to get the latest development version:
install.packages("remotes")
remotes::install_github("rubenarslan/codebook")
Then run the following to get started:
library(codebook)
new_codebook_rmd()To cite the package, you can cite the open access paper, but to make your codebook traceable to the version of the package you used, you might also want to cite the archived package DOI.
Arslan, R. C. (2019). How to automatically document data with the codebook package to facilitate data re-use. Advances in Methods and Practices in Psychological Science. doi:10.1177/2515245919838783
Arslan, R. C. (2024). Automatic codebooks from survey metadata (2018). URL https://github.com/rubenarslan/codebook.
Here’s a simple rmarkdown template, that you could use to get
started. The resulting codebook will be an HTML file, but you can also
choose to generate PDFs or Word files by fiddling with the
output settings.
---
title: "Codebook"
output:
  html_document:
    toc: true
    toc_depth: 4
    toc_float: true
    code_folding: 'hide'
    self_contained: true
  pdf_document:
    toc: yes
    toc_depth: 4
    latex_engine: xelatex
---

```{r setup}
knitr::opts_chunk$set(
  warning = TRUE, # show warnings during codebook generation
  message = TRUE, # show messages during codebook generation
  error = TRUE, # do not interrupt codebook generation in case of errors,
                # usually makes debugging easier, and sometimes half a codebook
                # is better than none
  echo = FALSE  # don't show the R code
)
ggplot2::theme_set(ggplot2::theme_bw())

```

Here, we import data from formr

```{r}
library(formr)
source(".passwords.R")
formr_connect(email = credentials$email, password = credentials$password)
codebook_data <- formr_results("s3_daily")
```

But we can also import data from e.g. an SPSS file.
```{r}
codebook_data <- rio::import("s3_daily.sav")
```


Sometimes, the metadata is not set up in such a way that codebook
can leverage it fully. These functions help fix this.

```{r codebook}
library(codebook) # load the package
# omit the following lines, if your missing values are already properly labelled
codebook_data <- detect_missing(codebook_data,
    only_labelled = TRUE, # only labelled values are autodetected as
                                   # missing
    negative_values_are_missing = FALSE, # negative values are NOT missing values
    ninety_nine_problems = TRUE,   # 99/999 are missing values, if they
                                   # are more than 5 MAD from the median
    )

# If you are not using formr, the codebook package needs to guess which items
# form a scale. The following line finds item aggregates with names like this:
# scale = scale_1 + scale_2R + scale_3R
# identifying these aggregates allows the codebook function to
# automatically compute reliabilities.
# However, it will not reverse items automatically.
codebook_data <- detect_scales(codebook_data)
```

Now, generating a codebook is as simple as calling codebook from a chunk in an
rmarkdown document.

```{r}
codebook(codebook_data)
```