
![]()
![]()

The imgpalr package makes it easy to create color
palettes from image files.
Install the CRAN release of imgpalr with
install.packages("imgpalr")Install the development version from GitHub with
# install.packages("remotes")
remotes::install_github("leonawicz/imgpalr")The main function is image_pal(). It accepts PNG, JPG,
BMP or GIF (first frame) images either from disk or URL. It returns a
vector of colors defining a palette based on the image and your other
function arguments. You can also set plot = TRUE to plot a
preview of the palette, which includes the source image thumbnail for
visual reference.
The examples below offer some typical considerations to make when deriving a color palette from an arbitrary image.
In this first set of examples, divergent, qualitative and sequential palettes are generated from the same image and while varying some additional settings.
library(imgpalr)

set.seed(1)
x <- paste0(system.file(package = "imgpalr"), "/",
  c("blue-yellow", "purples", "colors"), ".jpg")

# Three palette types, one image
# A divergent palette
image_pal(x[1], type = "div",
  saturation = c(0.75, 1), brightness = c(0.75, 1), plot = TRUE)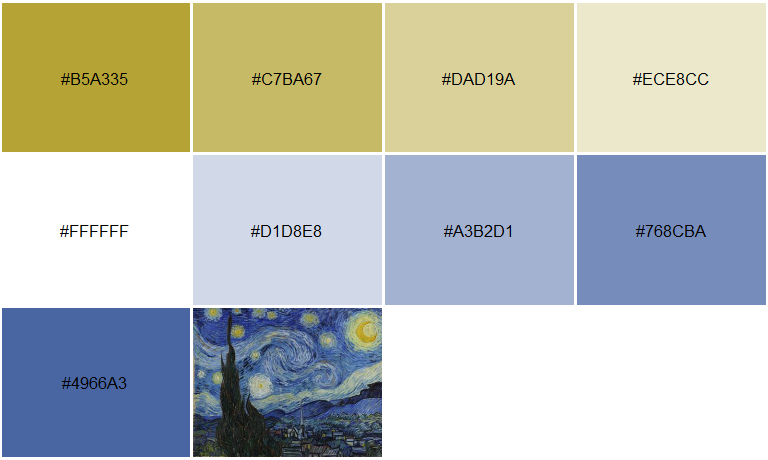
# A qualitative palette
image_pal(x[1], type = "qual", bw = c(0.25, 0.9), plot = TRUE)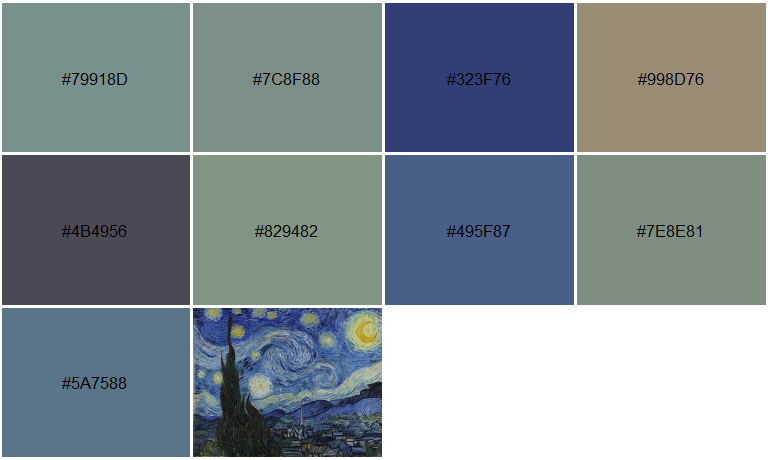
 # A sequential palette
image_pal(x[1], type = "seq", k = 2, saturation = c(0.75, 1),
  brightness = c(0.75, 1), seq_by = "hsv", plot = TRUE)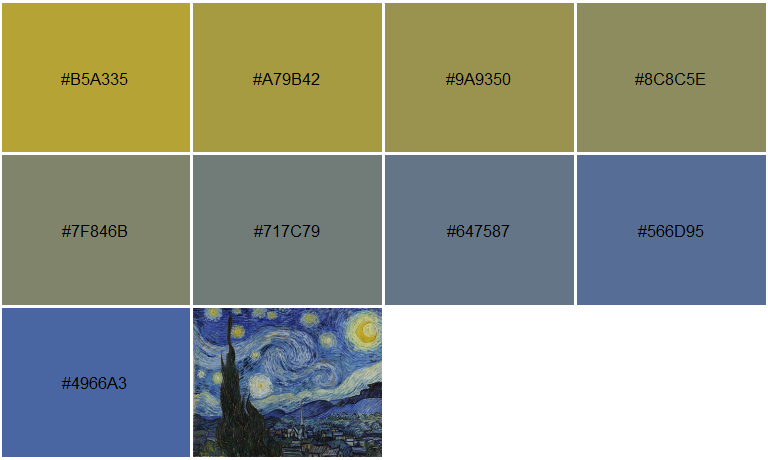
In this test image, hue varies over a narrow range. A sequential palette is sensible here, but not necessarily best sorted by hue. Doing so does still show a perceivable order to the colors, but it is much more difficult to discern. Sorting the palette first by saturation or brightness makes a much better sequential palette in this case.
image_pal(x[2], type = "seq", seq_by = "hsv", plot = TRUE)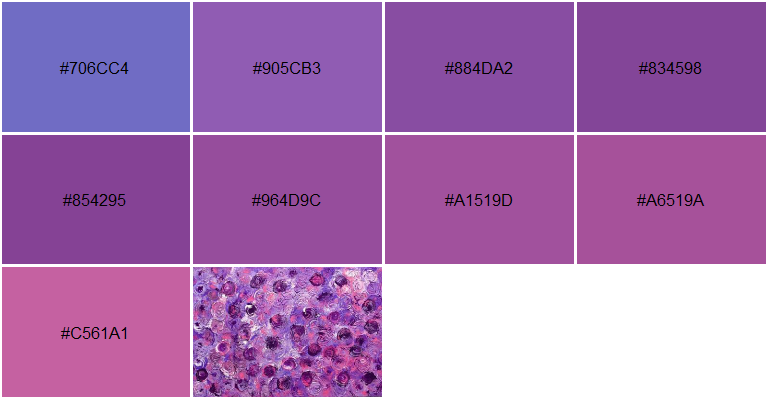
image_pal(x[2], type = "seq", seq_by = "svh", plot = TRUE)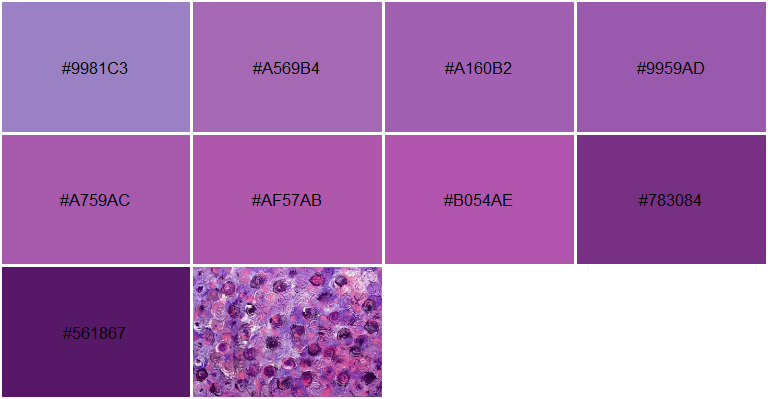
image_pal(x[2], type = "seq", seq_by = "vsh", plot = TRUE)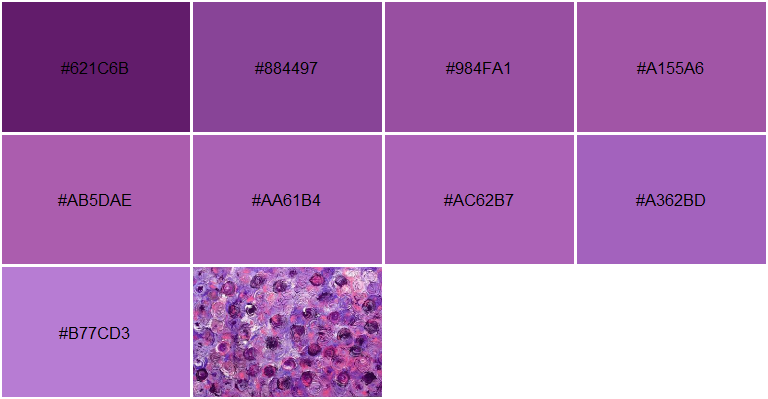
Using an image with several prominent hues, a divergent palette is not sensible here. A sequential is likely best sorted by hue.
Note in the second image below, you can also set
quantize = TRUE to show a color-quantized reference
thumbnail image based on the derived palette. This makes use of the
image_quantmap() function. Rather than only quantizing the
image, it does so while also mapping the colors of any image to an
arbitrary color palette based on nearest distances in RGB space.
image_pal(x[3], type = "qual", brightness = c(0.4, 1), plot = TRUE)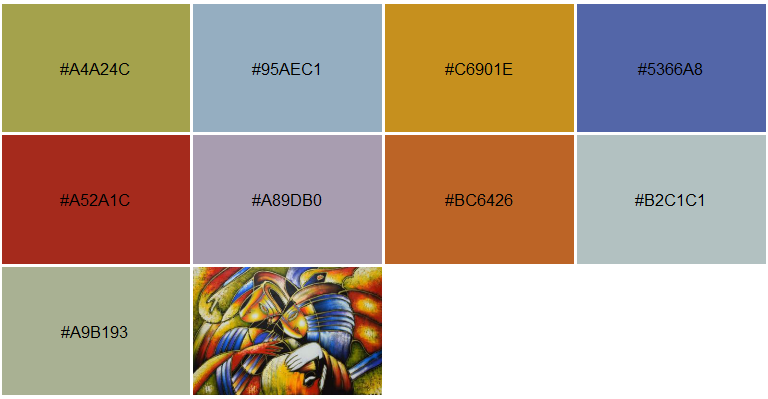
image_pal(x[3], type = "seq", bw = c(0.2, 1), saturation = c(0.2, 1),
          plot = TRUE, quantize = TRUE)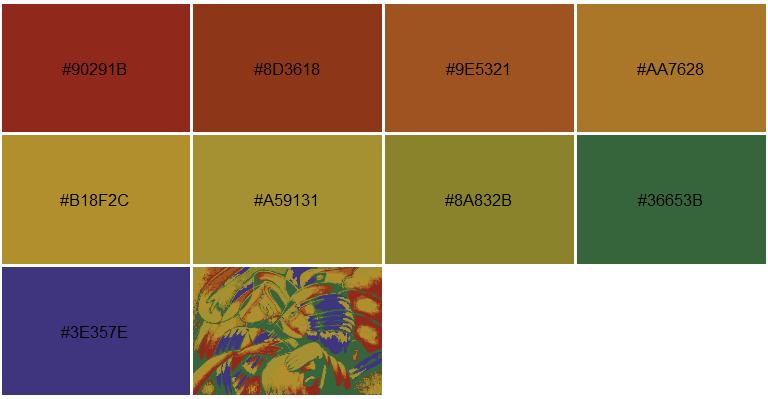
Palette generation uses k-means clustering; results are different
each time you call image_pal(). If the palette you obtain
does not feel right, even with fixed arguments you can run it again to
obtain a different palette. Depending on the settings and the nature of
the source image, it may change quite a bit. If you need a reproducible
palette, set the seed argument. In the example above, the
seed was set globally to avoid having to set it in each call to
image_pal().
You can quantize the colors in an image using
image_quantmap() directly. Choose any vector of colors.
Each pixel has its color mapped to whichever of these colors it is
closest to in RGB space. The RGB array is returned. You can plot the
image with the palette.
x <- system.file("blue-yellow.jpg", package = "imgpalr")
pal <- c("black", "navyblue", "dodgerblue", "yellow")
a <- image_quantmap(x, pal, k = 7, plot = TRUE)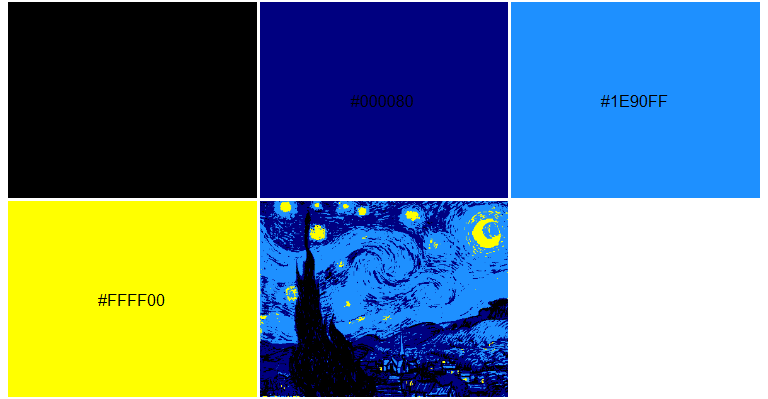
str(a)
#>  num [1:317, 1:400, 1:3] 0 0 0 0 0 0 0 0 0 0 ...
This works well if you want to quantize the colors to colors a short
distance away in RGB space, but if you want to also swap them out for
very different colors, this should be a two step process. If you provide
an equal-length vector of colors to the pal2 argument,
these colors will replace those in pal after the initial
quantization.
pal2 <- c("darkred", "darkgreen", "tomato", "orange")
a <- image_quantmap(x, pal, pal2, k = 7, plot = TRUE, show_pal = FALSE)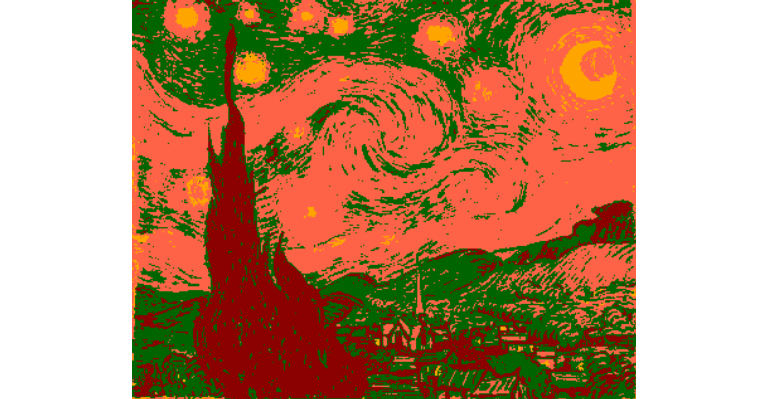
Note: This function can be very slow for large k and/or
larger images.
There is also the RImagePalette package on CRAN, which uses the median cut algorithm for finding they dominant colors in an image.
imgpalr was originally inspired by the paletter package
on GitHub. Both packages use k-means clustering to find key image
colors, but take some different approaches in methods for assembling
color palettes.
The palette preview (without the thumbnail addition) is based off of
scales::show_col(), which is a convenient function for
plotting palettes. You can also use pals::pal.bands() to do
the same using a different visual layout.
If you want to directly manipulate the color properties of an image for its own sake rather than derive color palettes for other purposes, you can do so using the magick package, which provides bindings to the ImageMagick library.
Matthew Leonawicz (2024). imgpalr: Create Color Palettes from Images. R package version 0.4.0. https://CRAN.R-project.org/package=imgpalr
Contributions are welcome. Contribute through GitHub via pull request. Please create an issue first if it is regarding any substantive feature add or change.
Please note that the imgpalr project is released with a
Contributor
Code of Conduct. By contributing to this project, you agree to abide
by its terms.