

![]()
![]()

![]()
A user-friendly interface, using Shiny, to analyse glucose-stimulated
insulin secretion (GSIS) assays in pancreatic beta cells or
islets.
The package allows the user to import several sets of experiments from
different spreadsheets and to perform subsequent steps: summarise in a
tidy format, visualise data quality and compare experimental conditions
without omitting to account for technical confounders such as the date
of the experiment or the technician.
Together, insane is a comprehensive method that optimises pre-processing
and analyses of GSIS experiments in a friendly-user interface.
The Shiny App was initially designed for EndoC-betaH1 cell line
following method described in Ndiaye et al., 2017 (https://doi.org/10.1016/j.molmet.2017.03.011).
# Install insane from CRAN:
install.packages("insane")

# Or the the development version from GitHub:
# install.packages("remotes")
remotes::install_github("mcanouil/insane")library("insane")
go_insane()
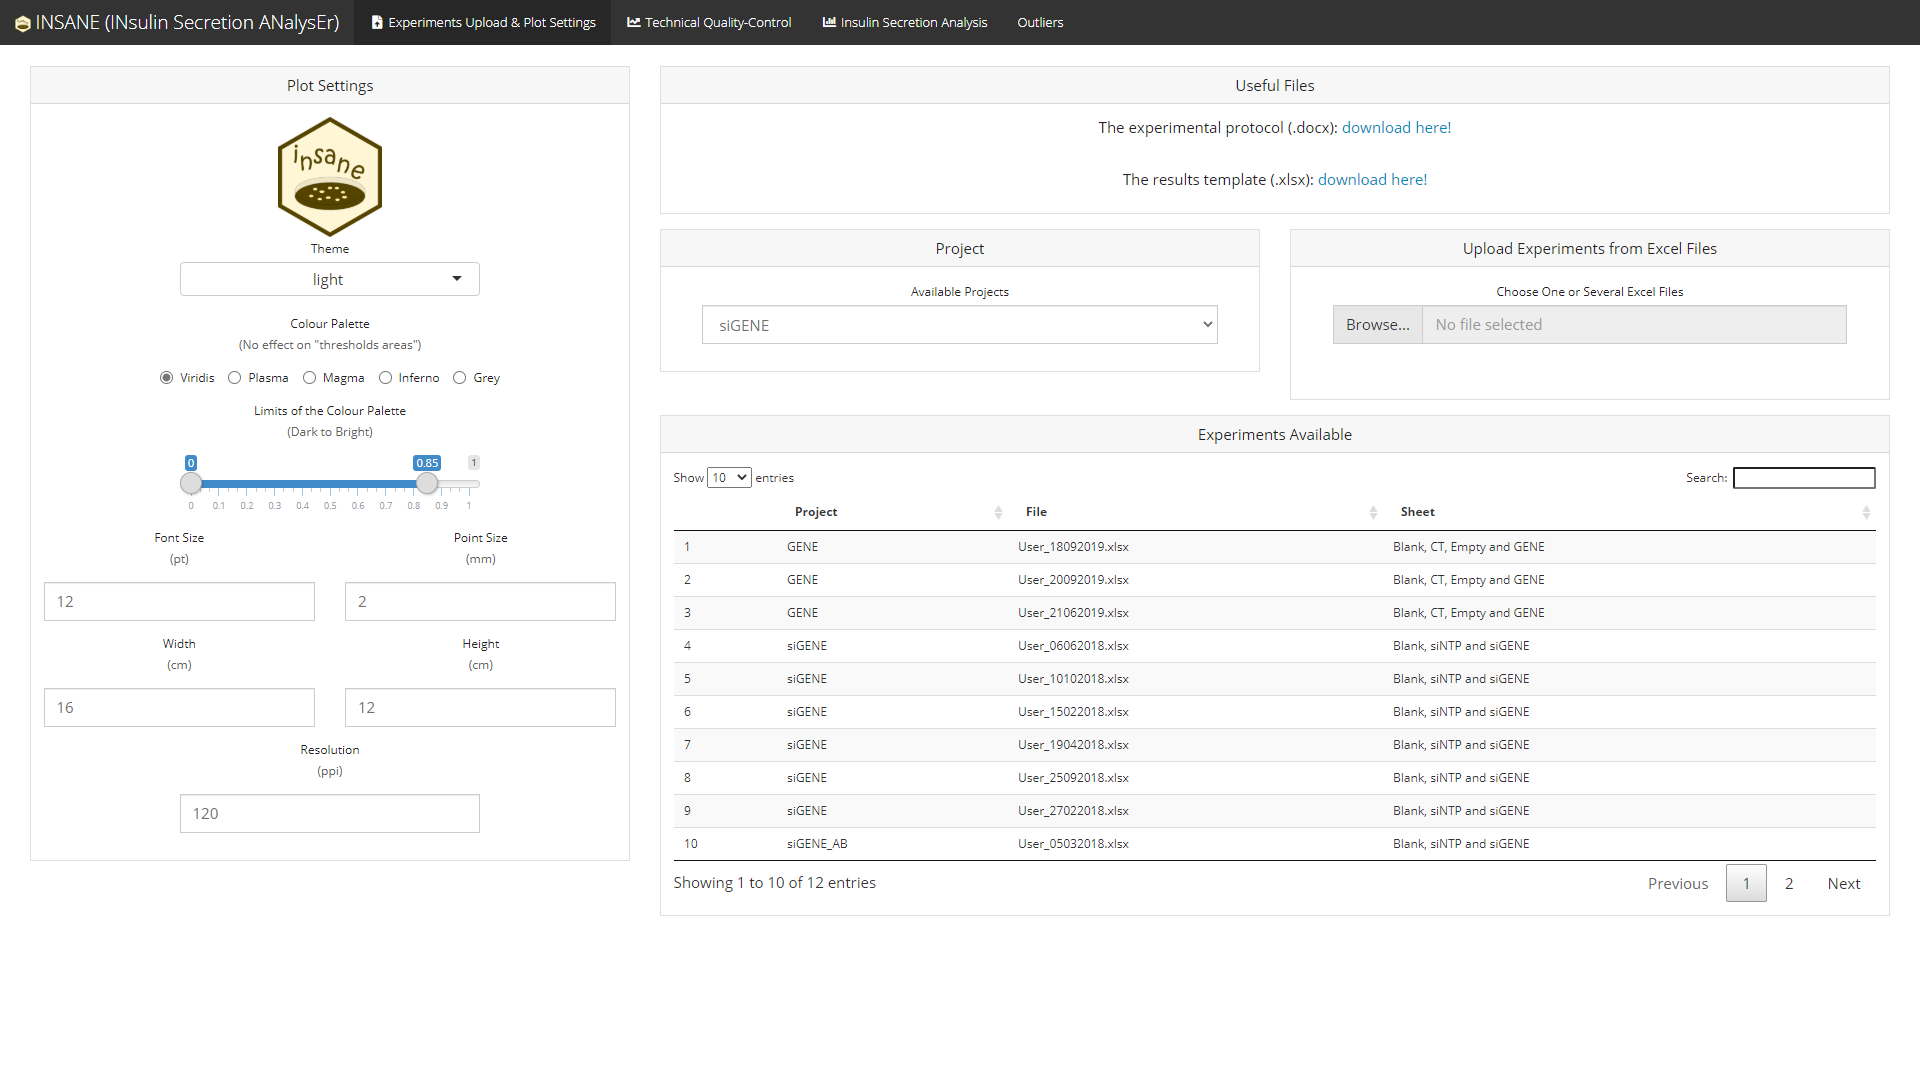
The Shiny (R package) application insane (INsulin Secretion ANalysEr) provides a web interactive tool to import experiments of insulin secretion using cell lines such as EndoC-βH1.
An Excel template is provided within the app to help users import their experiments in an easy way.
insane provides a user-friendly interface which can handle several projects separately.
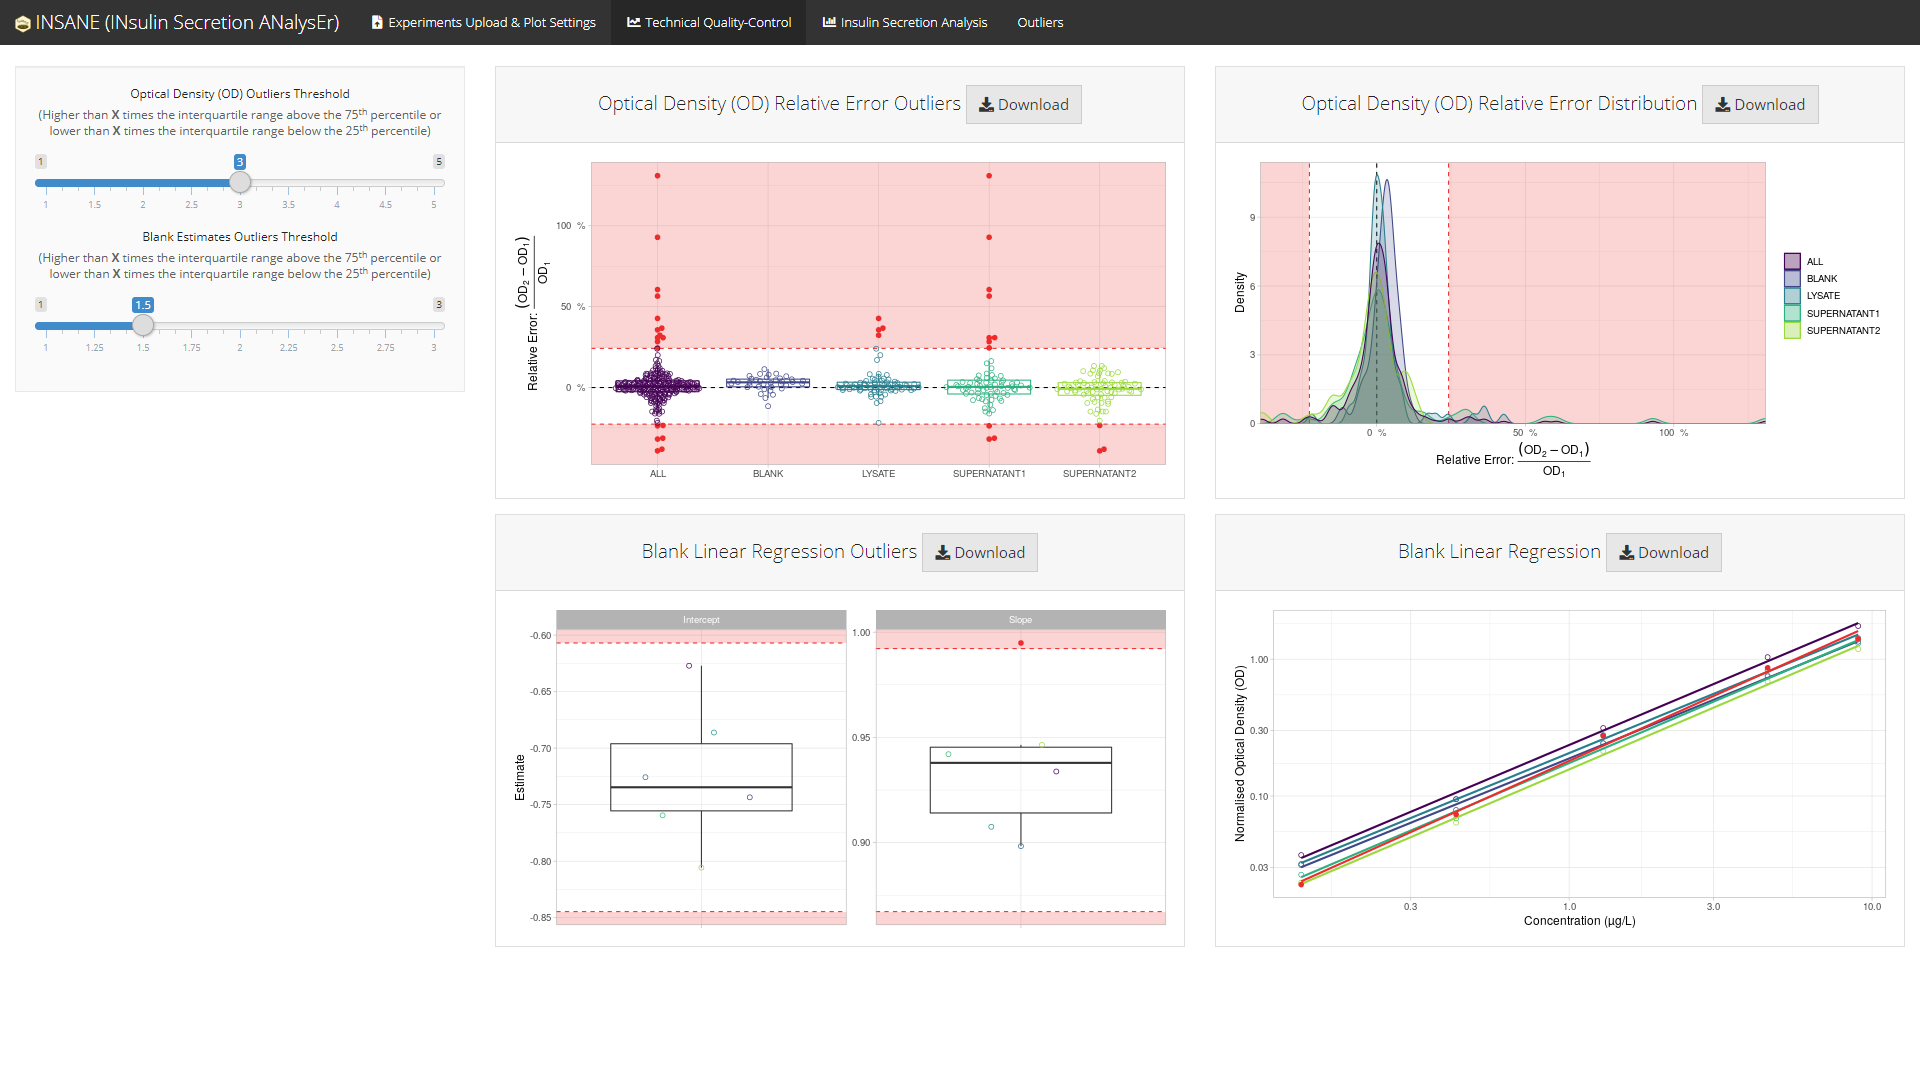
insane performs technical quality-control of the optical density measured in each steps of the experiments:
This technical quality-control step checks:
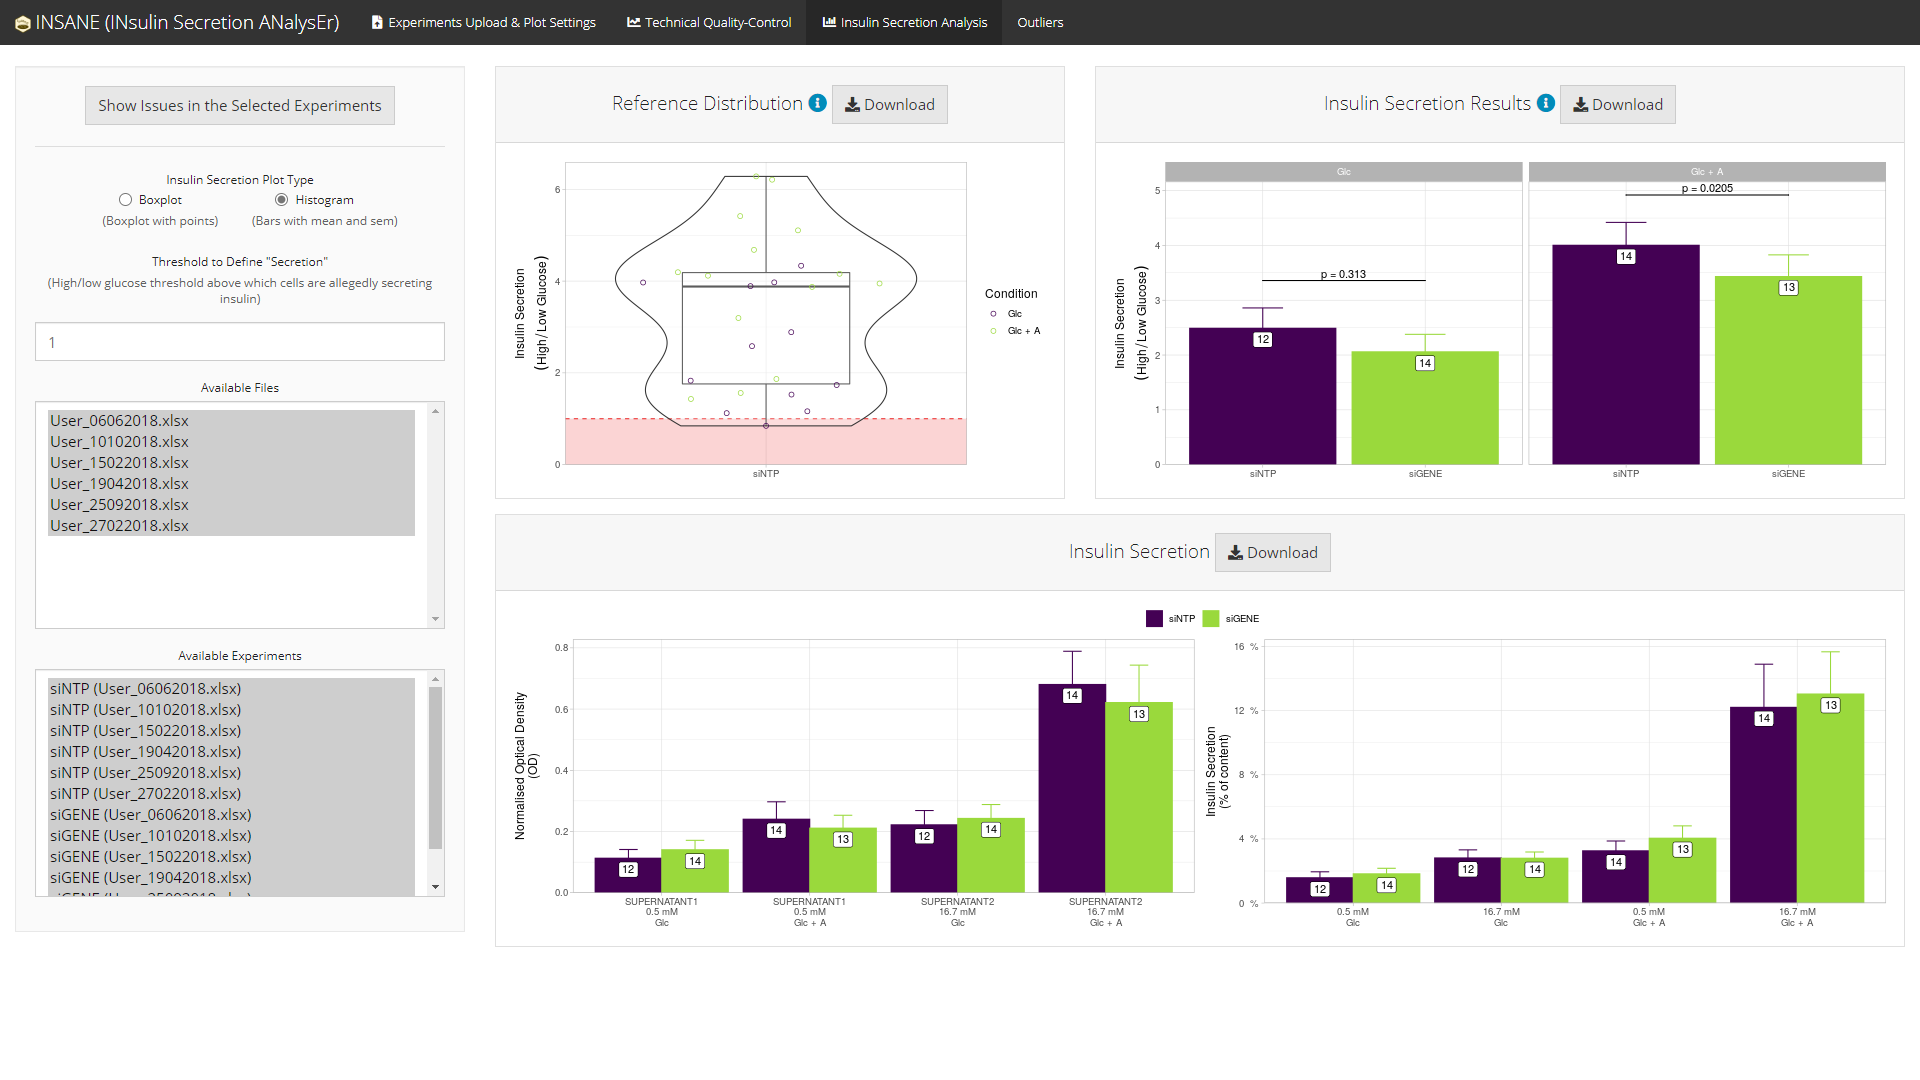
insane performs statistical analyses of the experimental conditions, e.g., one silenced gene (siGENE) compared to an insulin secretion reference (siNTP) in two stimulation conditions (Glc and Glc + A).
Conditions are compared using a linear regression with
Date and Operator as covariates (if needed) to
control for heterogeneity.
Using all experiments in the selected project
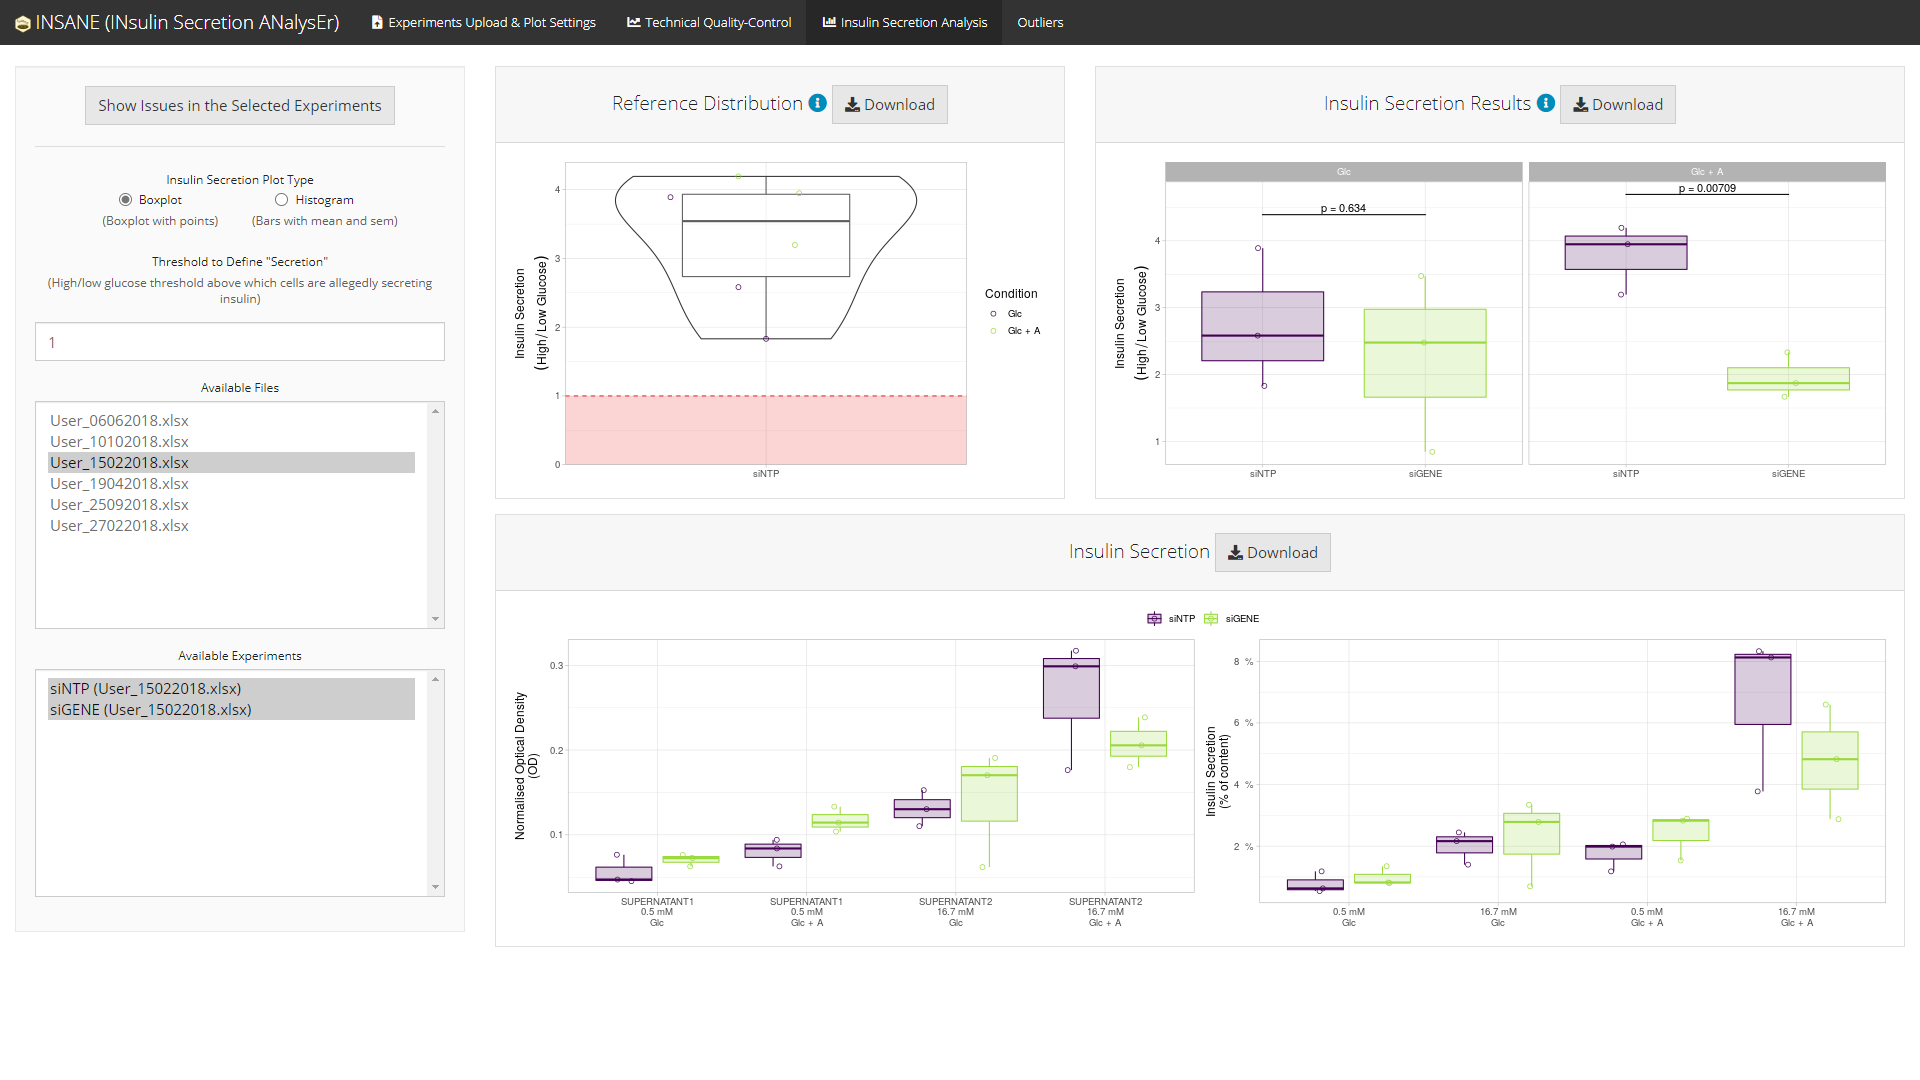
Boxplot version
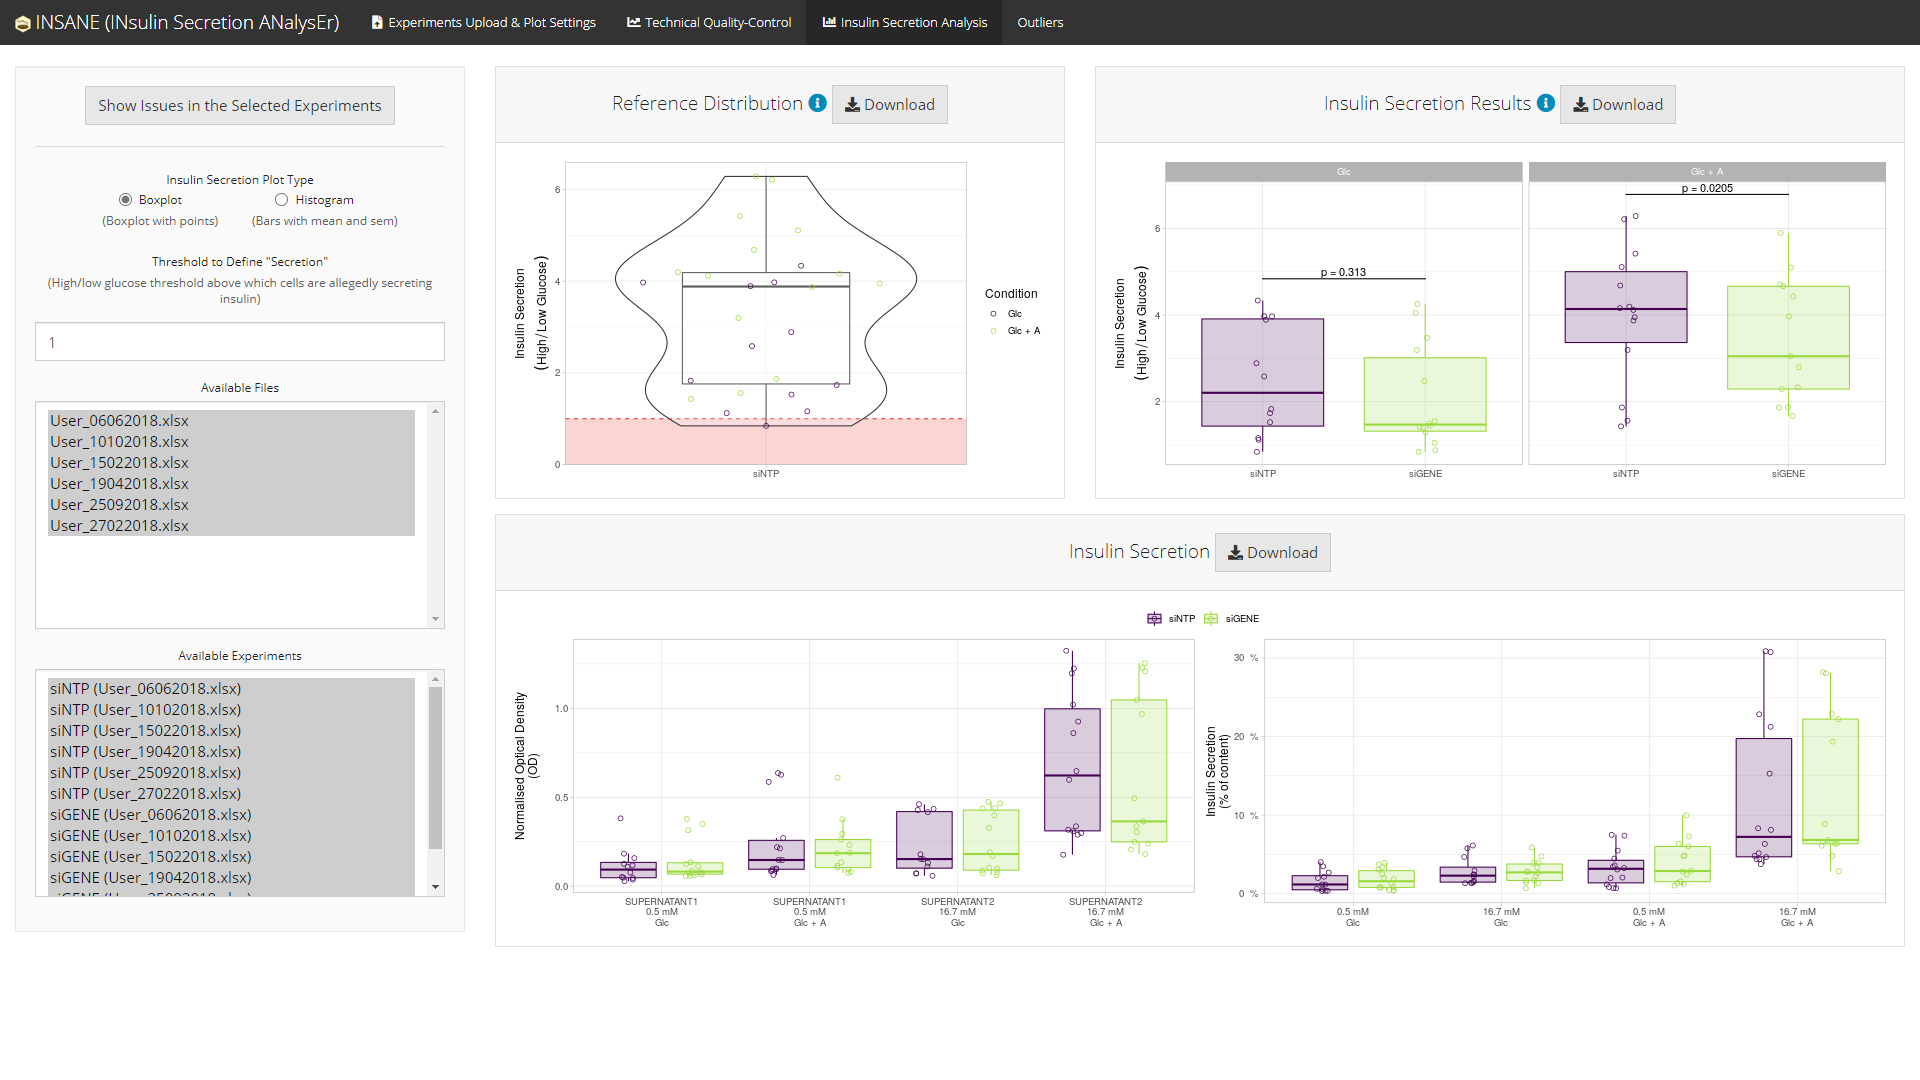
Histogram version
Using some of the experiments in the selected project
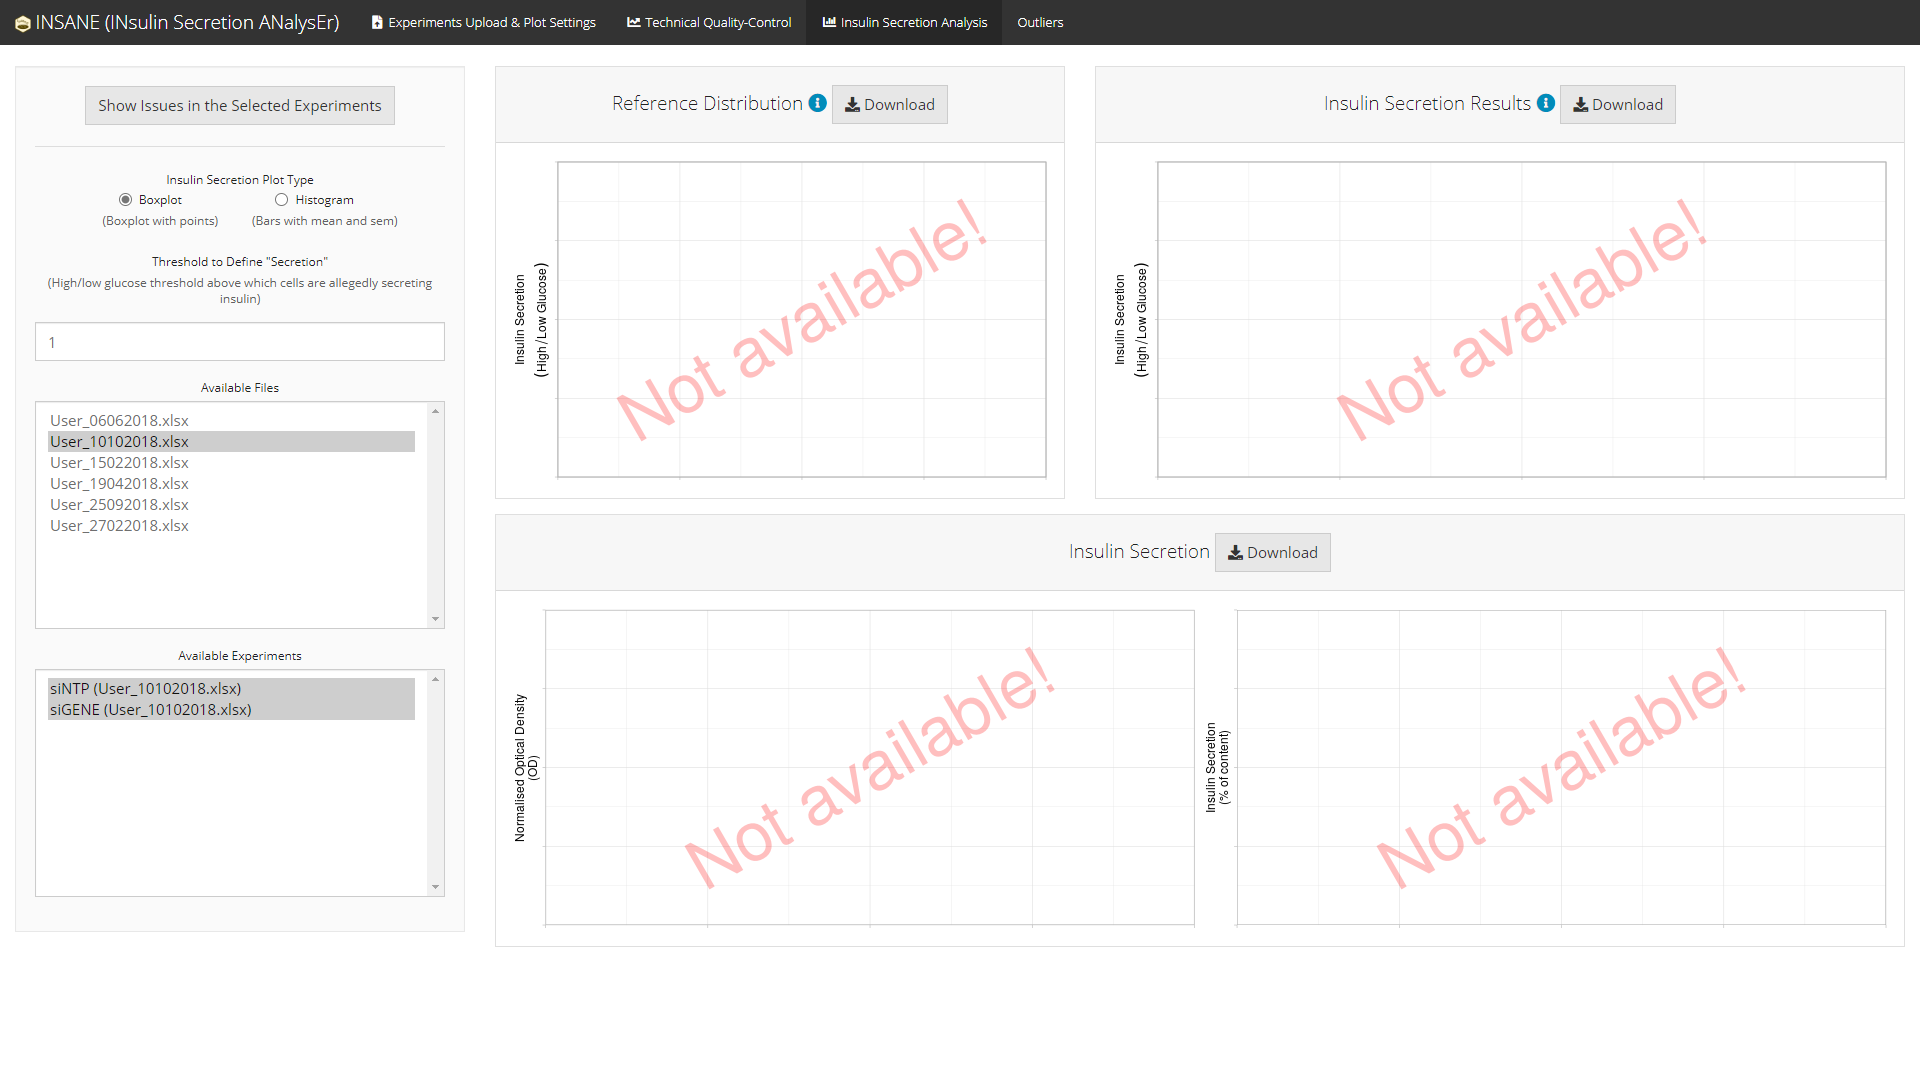
If and when some experiments are failing any of the technical
quality-controls, a summary of the issues regarding the selected
experiments can be displayed using the button
Show Issues in the Selected Experiments.

A comprehensive list of all issues detected in the selected project
is available in an Outliers tab.
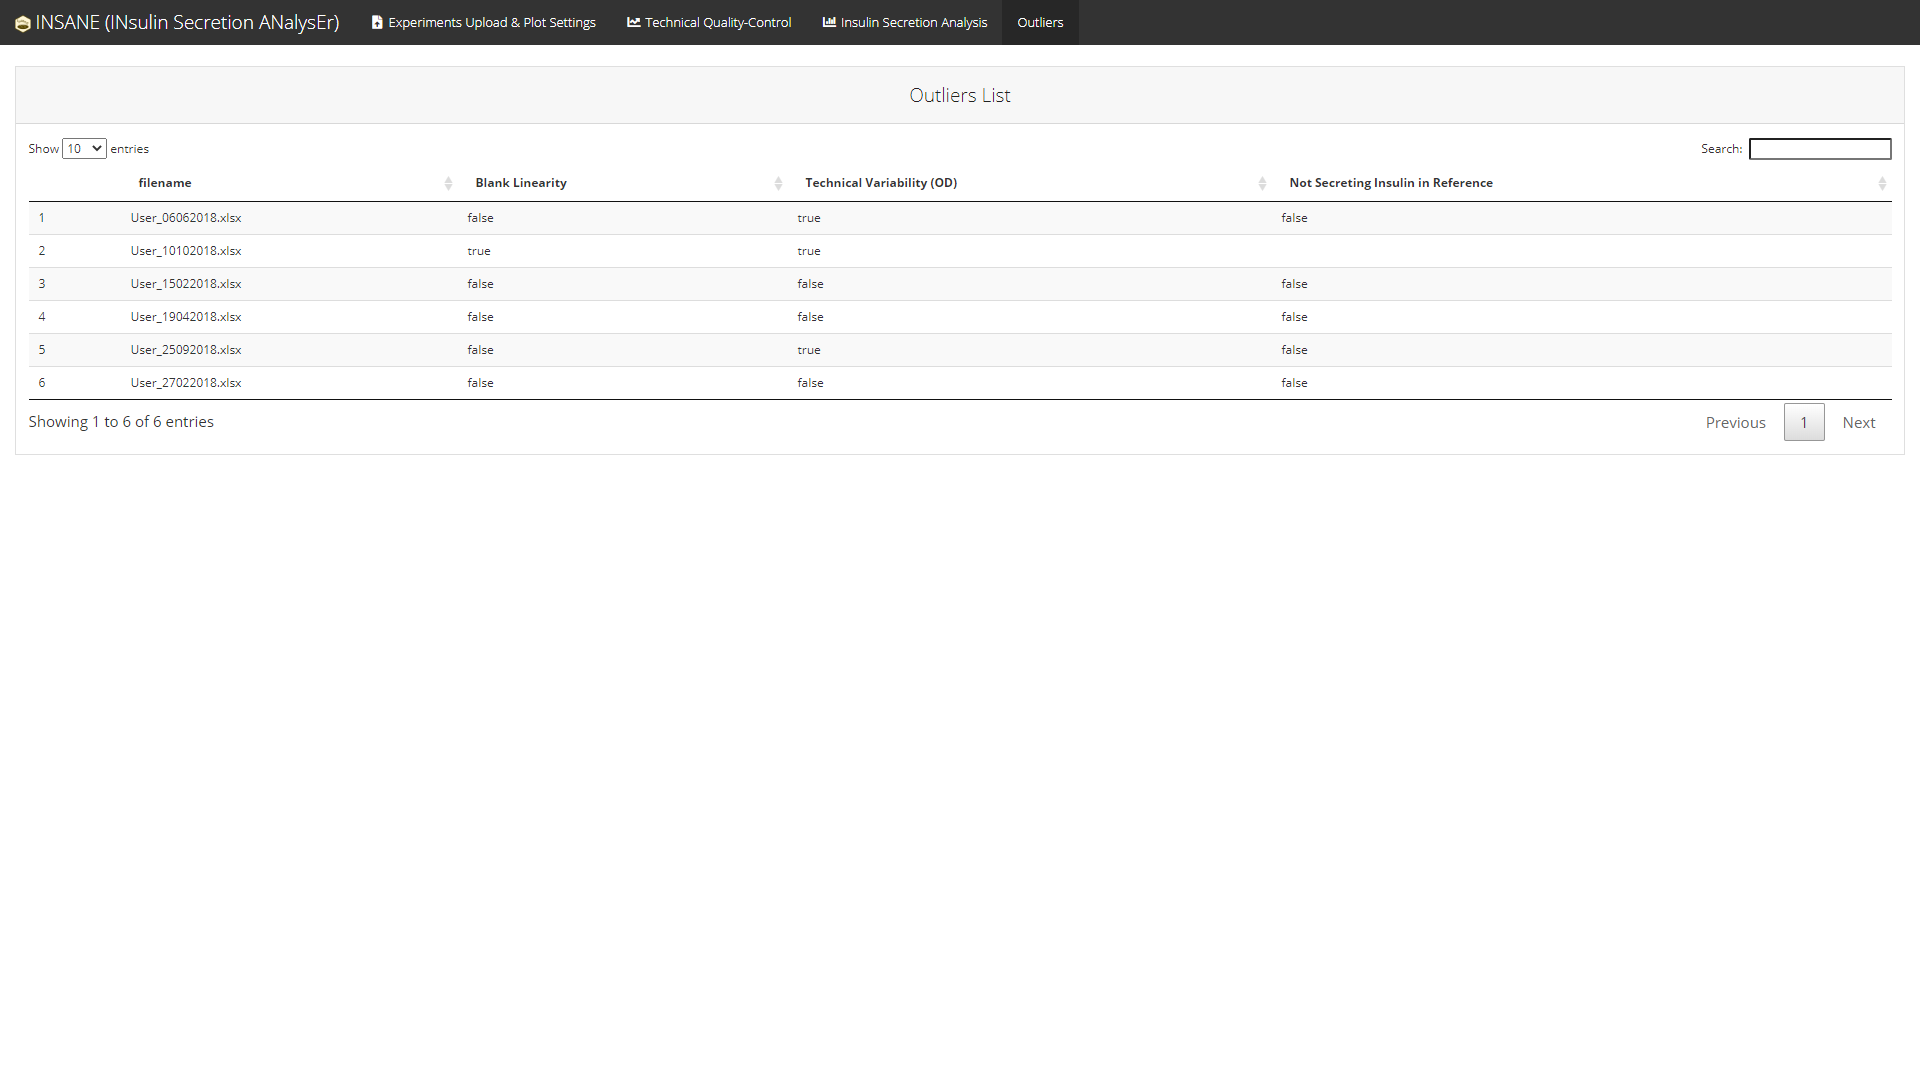
Note: The Outliers tab is displayed only if
there is at least one issue in the selected project.
If you encounter a clear bug, please file a minimal reproducible
example on github.
For questions and other discussion, please contact the package
maintainer.
Please note that this project is released with a Contributor
Code of Conduct.
By participating in this project you agree to abide by its terms.