High-throughput sequencing enables an unprecedented resolution in transcript quantification, at the cost of magnifying the impact of technical noise. The consistent reduction of random background noise to capture functionally meaningful biological signals is still challenging. Intrinsic sequencing variability introducing low-level expression variations can obscure patterns in downstream analyses.
The noisyR package comprises an end-to-end pipeline for quantifying and removing technical noise from HTS datasets. The three main pipeline steps are [i] similarity calculation across samples, [ii] noise quantification, and [iii] noise removal; each step can be finely tuned using hyperparameters; optimal, data-driven values for these parameters are also determined.
Preprint: https://www.biorxiv.org/content/10.1101/2021.01.17.427026v2
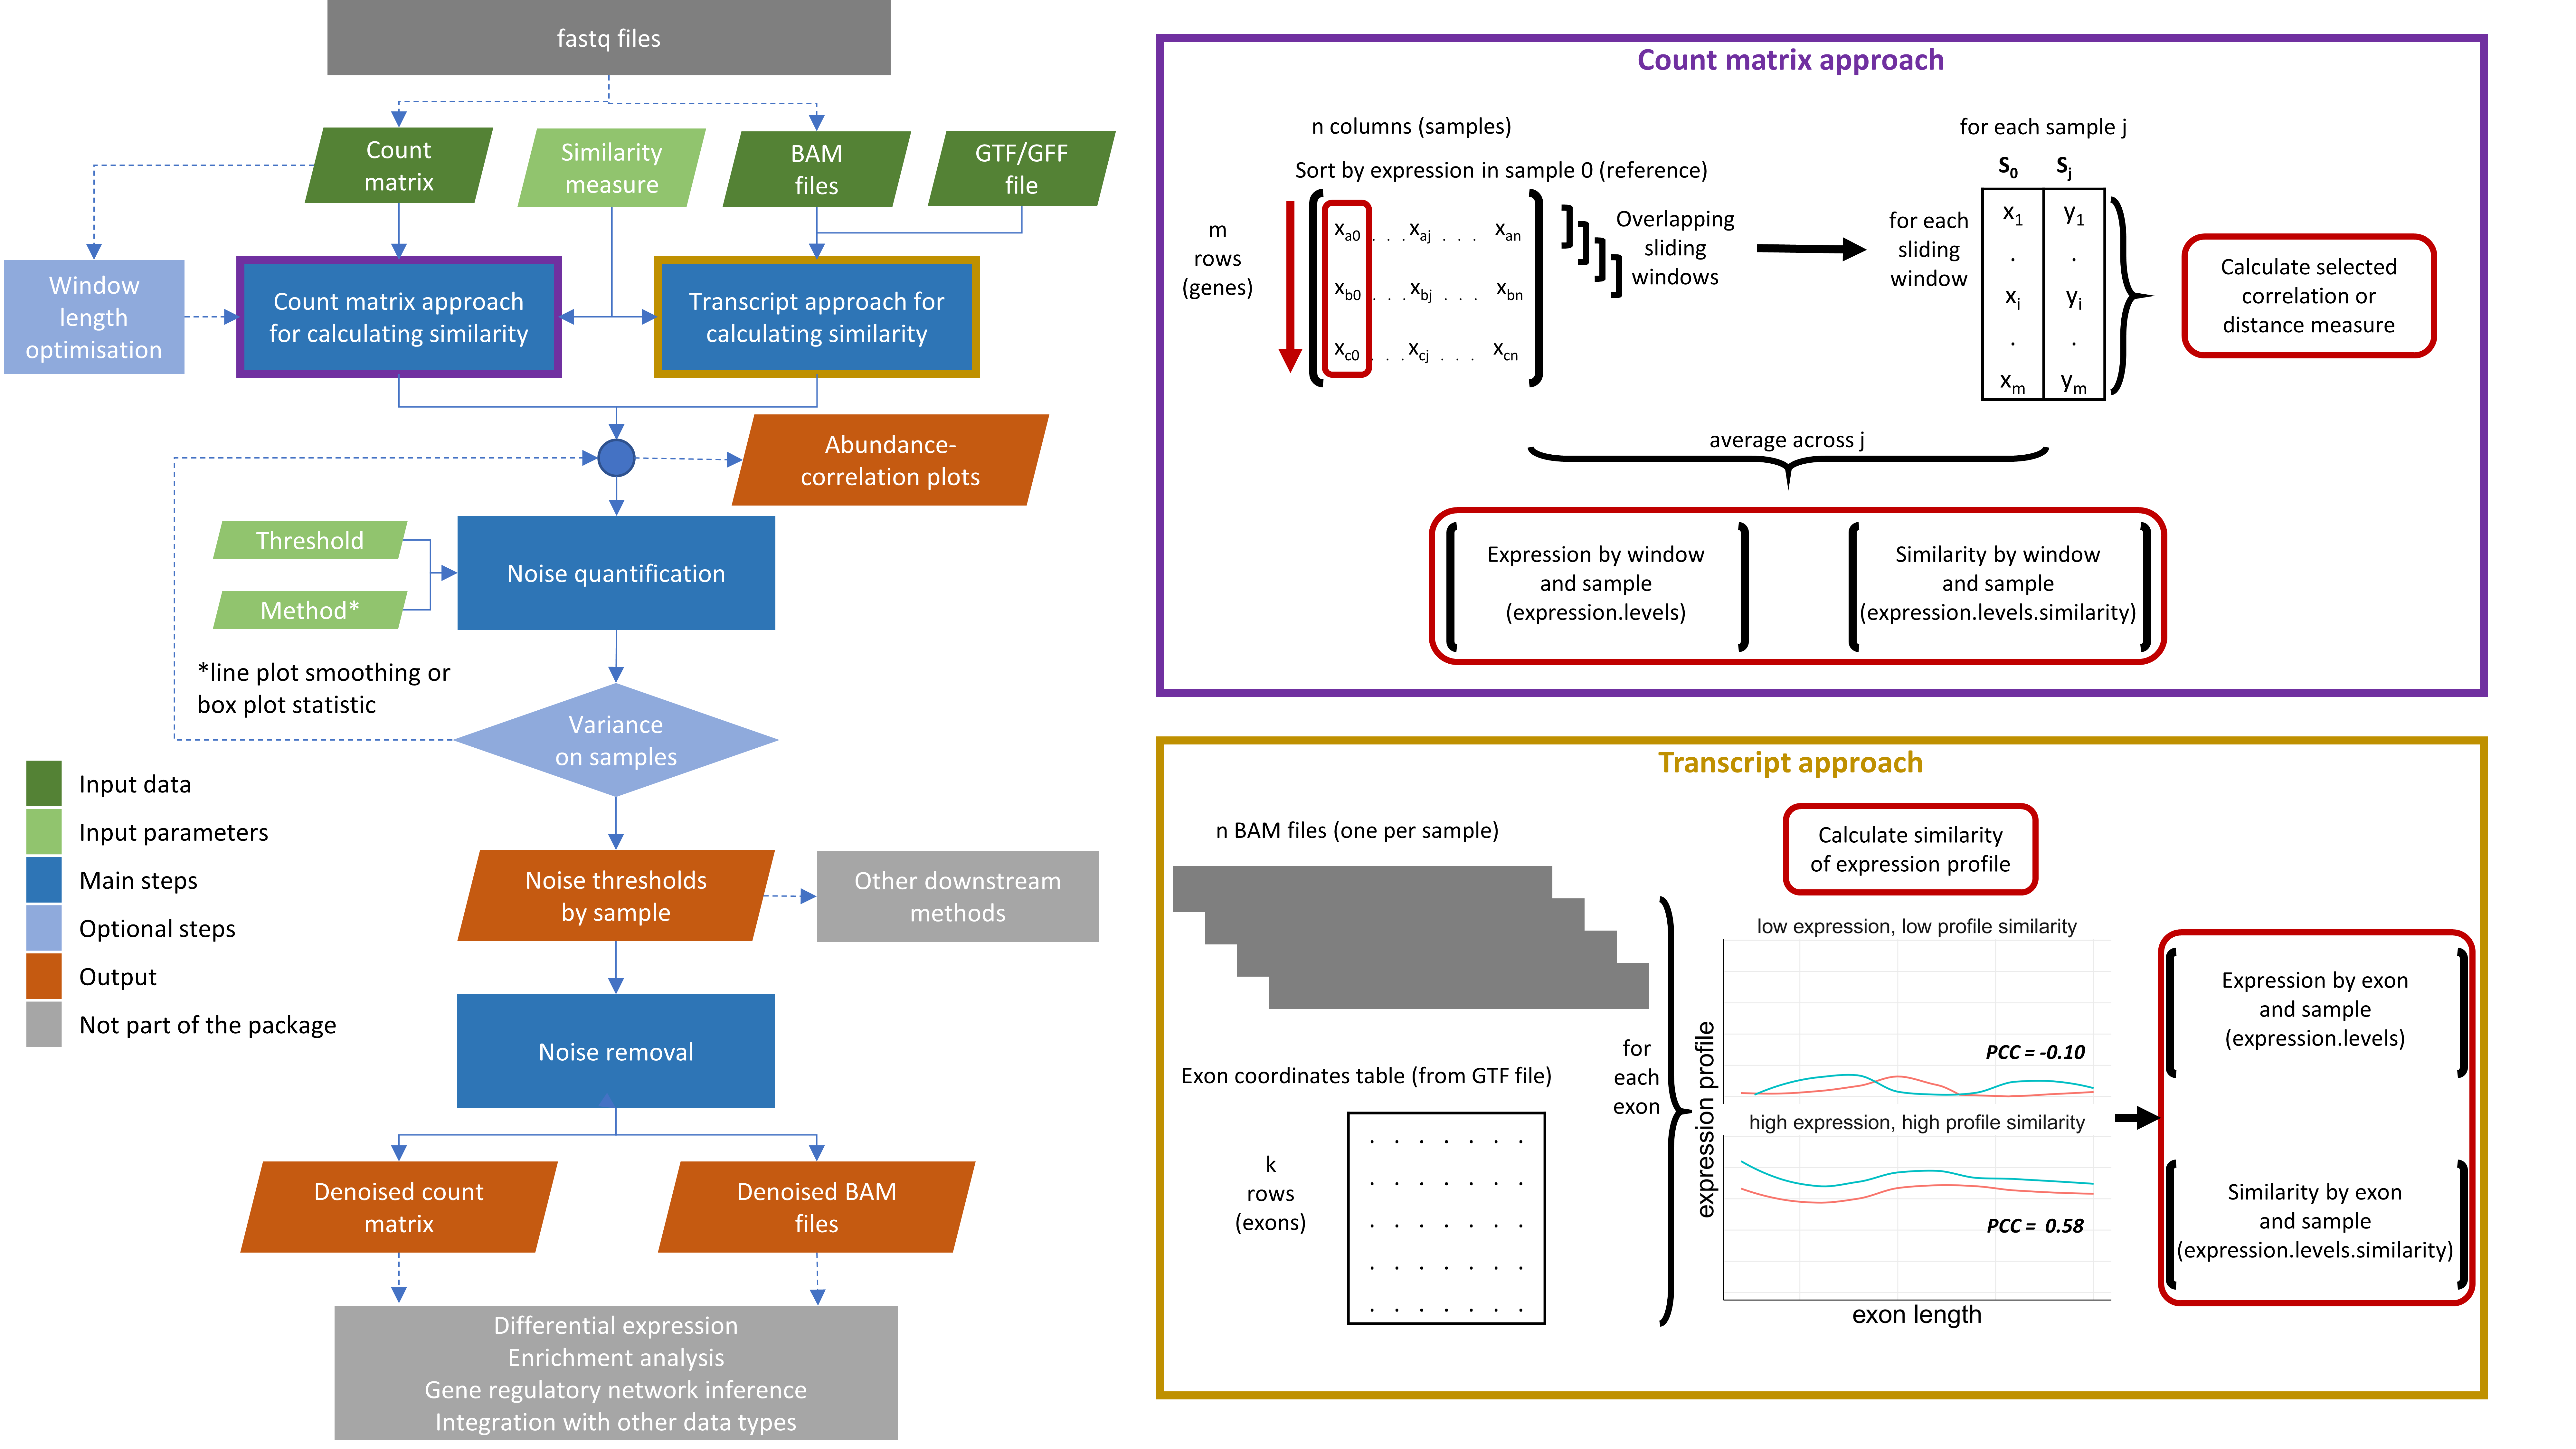
Workflow diagram of the noisyr pipeline
For the sample-similarity calculation, two approaches are available:
The output formats for the two approaches correspond to their inputs: a denoised count matrix for the count matrix approach, and denoised BAM files for the transcript approach.
Main functions: calculate_expression_similarity_counts(), calculate_expression_similarity_transcript()
Supporting functions: get_methods_correlation_distance(), optimise_window_length(), calculate_expression_profile()
Input preparation functions: cast_matrix_to_numeric(), cast_gtf_to_genes()
The noise quantification step uses the expression-similarity relation calculated in step i to determine the noise threshold, representing the level below which the gene expression is considered noisy.
For example, if a similarity threshold is used as input then the corresponding expression from a (smoothed) expression-similarity line plot is selected as the noise threshold for each sample. The shape of the distribution can vary across experiments; we provide functionality for different thresholds and recommend the choice of the one that results in the lowest variance in the noise thresholds across samples.
Options for smoothing, or summarising the observations in a box plot and selecting the minimum abundance for which the interquartile range (or median, or 5-95% range) is consistently above the similarity threshold are also available. As a general rule (due to the number of observations), we recommend using the smoothing with the count matrix approach, and the boxplot representation with the transcript option.
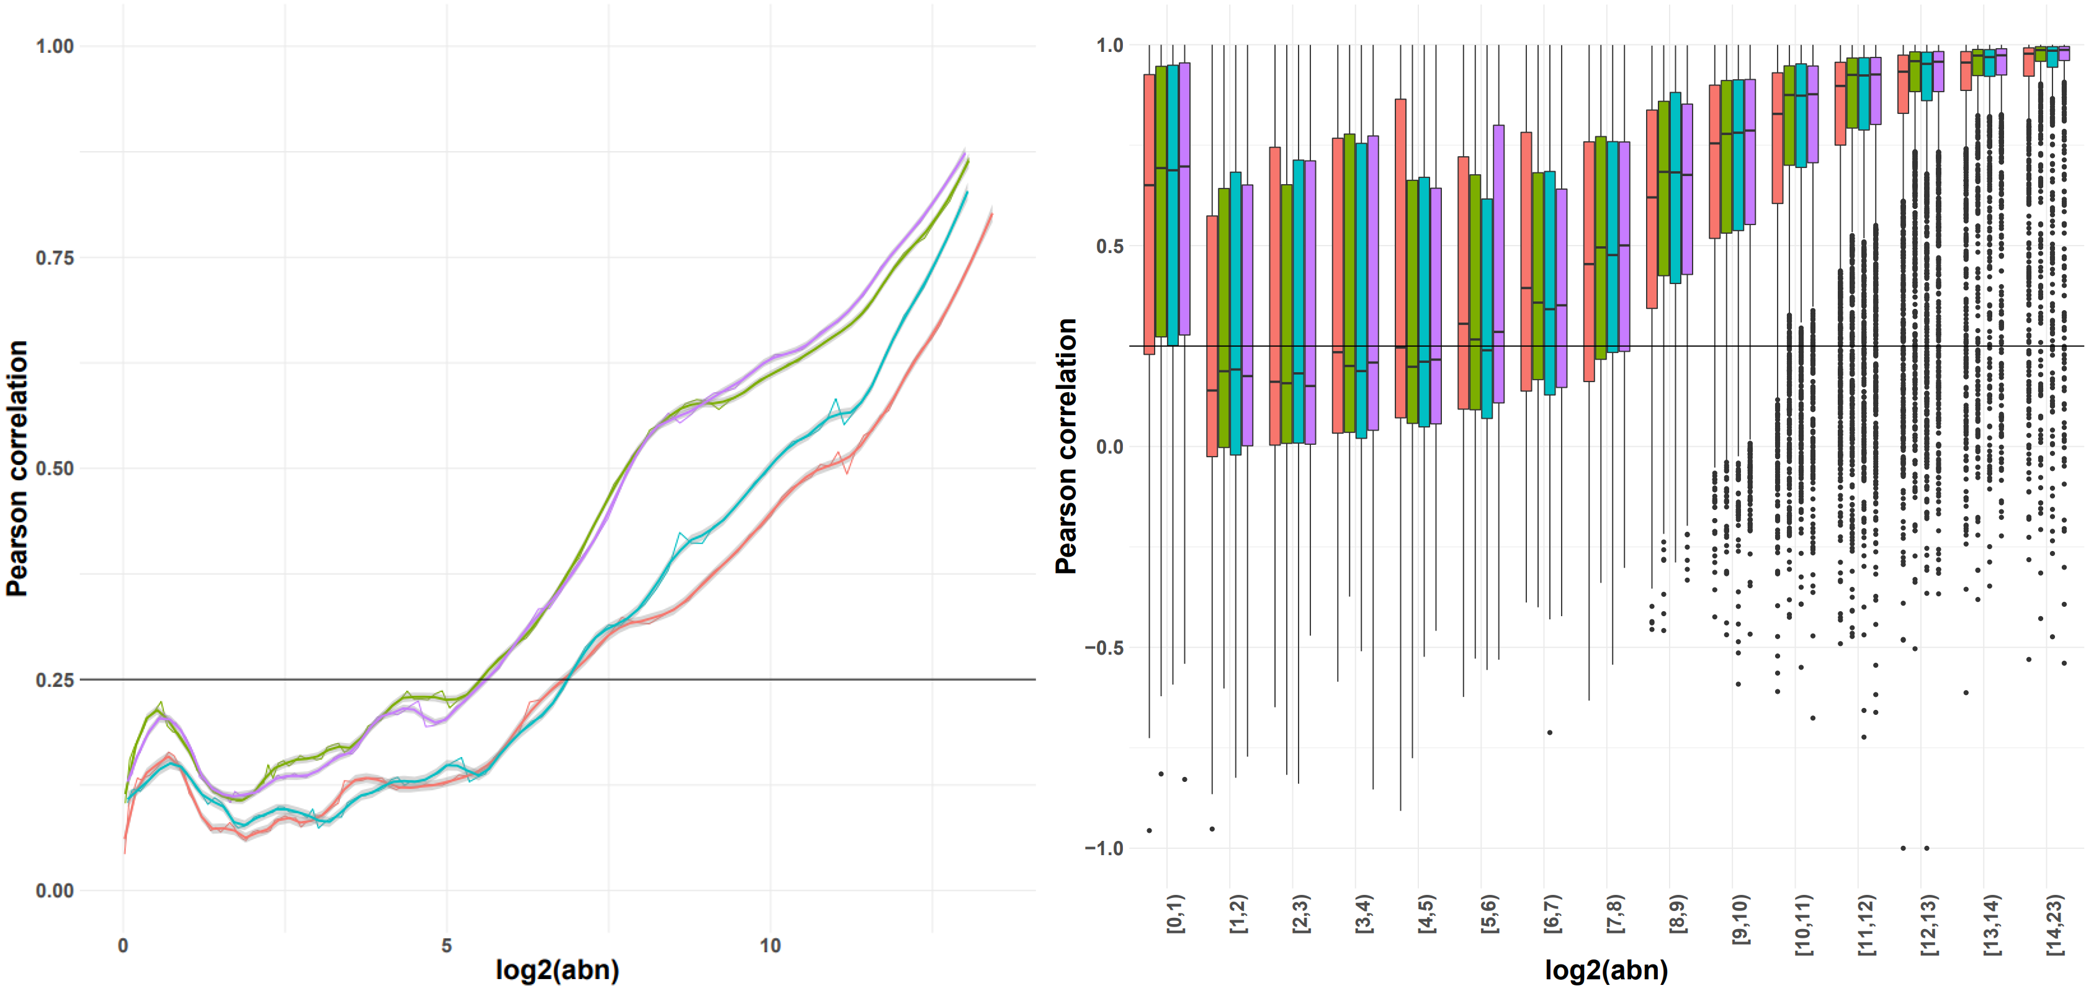
Indicative plots of the Pearson correlation calculated on windows of increasing average abundance for the count matrix-based noise removal approach (left) and per exon for the transcript-based noise removal approach (right).
Main function: calculate_noise_threshold_base()
Supporting functions: get_methods_calculate_noise_threshold(), calculate_first_minimum_density()
Visualisation functions: plot_expression_similarity(), calculate_noise_threshold_method_statistics()
The third step uses the noise threshold calculated in step ii to remove noise from the count matrix or BAM files.
Main functions: remove_noise_from_matrix(), remove_noise_from_bams()