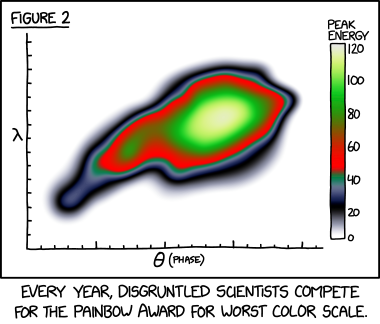
Painbow lets you use XKCD’s “painbow” colormap in ggplot.
XKCD implied that this colormap is terrible, and even called it a “painbow”. However, these examples show that with certain tasks and data, this colormap outperforms even some of the most commonly cited “good” colormaps like viridis.
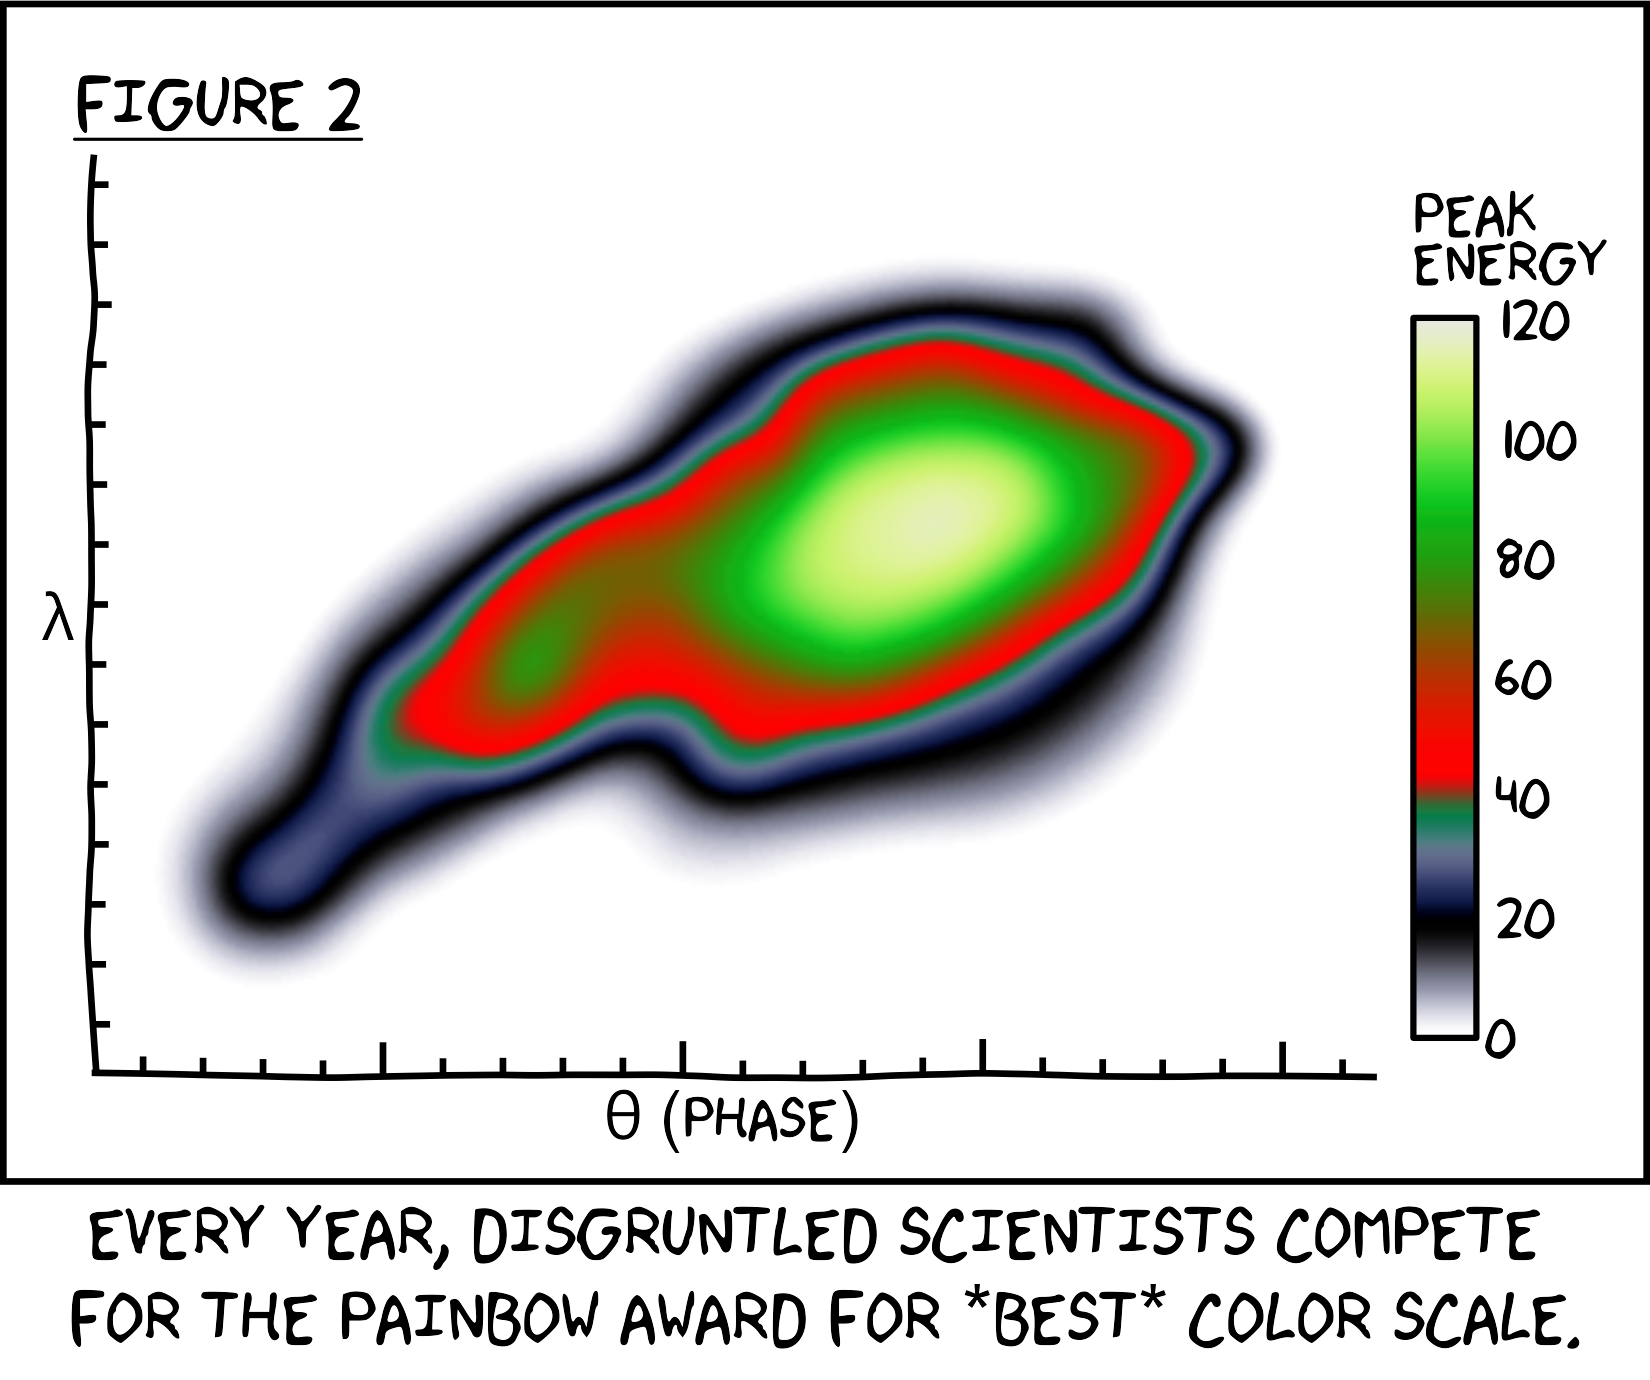
Here’s a reproduction in ggplot using some custom theming:
You can install the latest development version:
install.packages("devtools")
devtools::install_github("steveharoz/painbow")Setup:
library(tidyverse)
library(painbow)
library(patchwork) # combine multiple graphsggplot(faithfuld) +
aes(waiting, eruptions, fill = density) +
geom_raster(interpolate = TRUE) +
scale_fill_painbow() +
labs(title = "Can you find the most dense region?") +
theme_bw(18)
The dataset is painbow_data. It was made using the
comic’s image and a scripted lookup table.

Here is a 2D field with a regular pattern and a deviation. Can you find it? Painbow makes a task easier compared with commonly touted “good” colormaps.
##### 2D #####

COUNT = 512

data = expand.grid(
  x = 1:COUNT,
  y = 1:COUNT) %>%
  mutate(z = sin(x/16) + cos(y/16)) %>%
  mutate(znoise = z + dnorm(sqrt((x-0.75*COUNT)^2 + (y-0.33*COUNT)^2)/COUNT*20))

ggplot(data) +
  aes(x=x, y=y, fill=znoise) +
  geom_raster() +
  labs(title = "ggplot default", fill=NULL) +
  theme_void(15) + theme(legend.text = element_blank()) +
ggplot(data) +
  aes(x=x, y=y, fill=znoise) +
  geom_raster() +
  scale_fill_viridis_c() +
  labs(title = "Viridis", fill=NULL) +
  theme_void(15) + theme(legend.text = element_blank()) +
ggplot(data) +
  aes(x=x, y=y, fill=znoise) +
  geom_raster() +
  scale_fill_painbow() +
  labs(title = "XKCD's colormap", fill=NULL) +
  theme_void(15) + theme(legend.text = element_blank()) +
patchwork::plot_annotation(
  title = "Three colormaps. Same data. Can you spot the weird region?",
  theme = theme(text = element_text(size=20)))
######## 1D #########

COUNT = 1024

data = tibble(
  x = 1:COUNT,
  y = x/COUNT + sin(x/4)/100
)

ggplot(data) +
  aes(x = x, y=x) +
  geom_line() +
  labs(title = "y = x") +
  theme_void(15) + theme(legend.text = element_blank()) +
ggplot(data) +
  aes(x = x, y=COUNT/2, fill=x) +
  geom_tile(width=1, height=COUNT, color=NA) +
  labs(title = "ggplot default") +
  theme_void(15) + theme(legend.text = element_blank()) +
ggplot(data) +
  aes(x = x, y=COUNT/2, fill=x) +
  geom_tile(width=1, height=COUNT, color=NA) +
  scale_fill_viridis_c() +
  labs(title = "viridis") +
  theme_void(15) + theme(legend.text = element_blank()) +
ggplot(data) +
  aes(x = x, y=COUNT/2, fill=x) +
  geom_tile(width=1, height=COUNT, color=NA) +
  scale_fill_painbow() +
  labs(title = "painbow") +
  theme_void(15) + theme(legend.text = element_blank()) +

ggplot(data) +
  aes(x = x, y=y) +
  geom_line() +
  labs(title = "y = x + sine wave") +
  theme_void(15) + theme(legend.text = element_blank()) +
ggplot(data) +
  aes(x = x, y=COUNT/2, fill=y) +
  geom_tile(width=1, height=COUNT, color=NA) +
  labs(title = "ggplot default") +
  theme_void(15) + theme(legend.text = element_blank()) +
ggplot(data) +
  aes(x = x, y=COUNT/2, fill=y) +
  geom_tile(width=1, height=COUNT, color=NA) +
  scale_fill_viridis_c() +
  labs(title = "viridis") +
  theme_void(15) + theme(legend.text = element_blank()) +
ggplot(data) +
  aes(x = x, y=COUNT/2, fill=y) +
  geom_tile(width=1, height=COUNT, color=NA) +
  scale_fill_painbow() +
  labs(title = "painbow") +
  theme_void(15) + theme(legend.text = element_blank()) +

patchwork::plot_layout(ncol=4) +
patchwork::plot_annotation(
    title = "Three colormaps. Same data. Can you spot the harmonic?",
    theme = theme(text = element_text(size=20)))
Feedback, suggestions, issues, and contributions are all welcome! Please file an issue or pull request at https://github.com/steveharoz/painbow/issues
The XKCD comic deserves credit: https://xkcd.com/2537/
Please cite this library via:
Steve Haroz (2021). Painbow. R package version 1.0.0, https://github.com/steveharoz/painbow/.