plotDK provides easy access to plot summary statistics as choropleth maps of danish administrative areas. plotDK supports geoms for danish regions, provices, municipalities, and zipcodes.
You can install the released version of plotDK from CRAN with:
install.packages("plotDK")or from github with:
devtools::install_github("https://github.com/kristianSN/plotDK")To simply show a choropleth map of a chosen administrative level (here regions) invoke:
library(plotDK)

plotDK(plotlevel = "region")![]()
Switching to plot municipalities is as simply as switching the plotlevel to “municipality”:
plotDK(plotlevel = "municipality")![]()
To fill the maps with values, first generate or load a data set containing one row per entity, with a valid ID column and a value column to be plotted. plotDK contains information of valid ID’s. For municipalities this data is saved in:
plotDK::municipality_infoHere let’s generate a dataset with valid region ID’s and assign each region a random numeric value:
valid_ids <- plotDK::municipality_info
municipality_data <- data.frame(
municipality_name = valid_ids$municipality_names,
numeric_value = sample(1:100, size = length(valid_ids$municipality_names), replace = TRUE),
stringsAsFactors = FALSE
)
municipality_data[1:20,]
#> municipality_name numeric_value
#> 1 aabenraa 8
#> 2 aalborg 52
#> 3 ærø 17
#> 4 albertslund 100
#> 5 allerød 89
#> 6 aarhus 47
#> 7 assens 59
#> 8 ballerup 45
#> 9 billund 60
#> 10 bornholm 20
#> 11 brøndby 28
#> 12 brønderslev 100
#> 13 christiansø 45
#> 14 dragør 98
#> 15 egedal 81
#> 16 esbjerg 1
#> 17 faaborg-midtfyn 36
#> 18 fanø 76
#> 19 favrskov 75
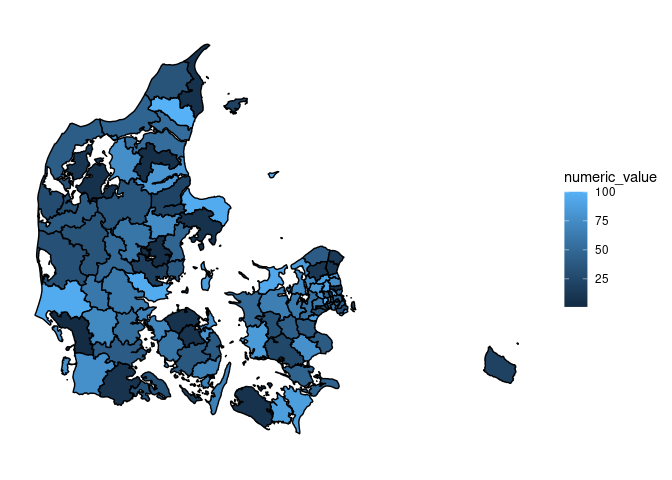
#> 20 faxe 78Plotting these values on their municipalities is as simple as providing the municipality data to plotDK(), while providing the names of the ID and value variables:
plotDK::plotDK(
  data = municipality_data,
  id = "municipality_name",
  value = "numeric_value",
  plotlevel = "municipality"
)
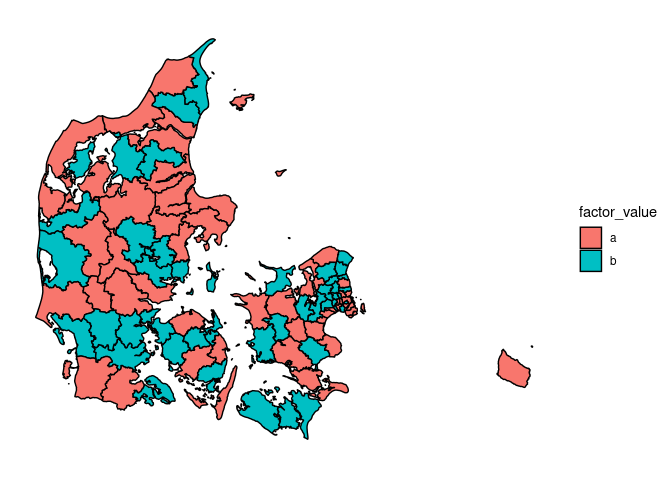
The value scales depends upon the type of the value variable. That is means if we try to plot a character or factor variable, the plot will change accordingly:
municipality_data <- data.frame(
  municipality_name = valid_ids$municipality_names,
  factor_value = factor(sample(c("a", "b"), size = length(valid_ids$municipality_names), replace = TRUE)),
  stringsAsFactors = FALSE
)

plotDK::plotDK(
  data = municipality_data,
  id = "municipality_name",
  value = "factor_value",
  plotlevel = "municipality"
)
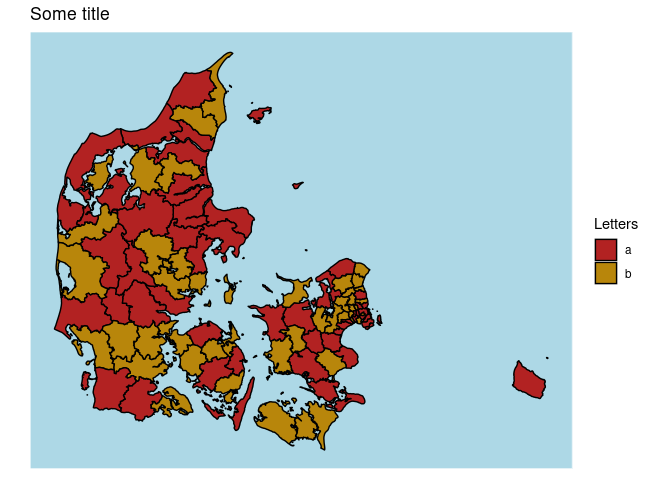
The resulting plots are ggplot2-objects. This means that they can be altered or styled with normal ggplot elements:
library(ggplot2)
p <- plotDK::plotDK(
  data = municipality_data,
  id = "municipality_name",
  value = "factor_value",
  plotlevel = "municipality"
)

p +
  ggtitle("Some title") +
  scale_fill_manual(
    values=c("firebrick", "darkgoldenrod"),
    name = "Letters"
  ) +
  theme(
    panel.background = element_rect(
      fill = "lightblue"
    )
  )
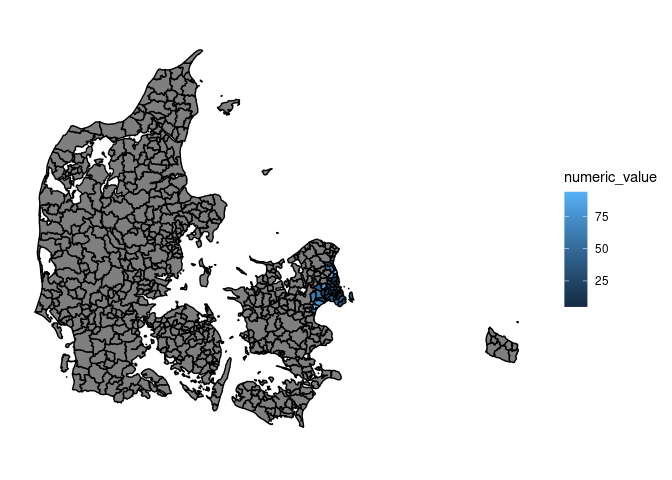
By default plotDK does not show missing entities. This means that subplots can easily be drawn, by only providing a subset of entities in the data:
zipcode_data <- plotDK::zipcode_info

zipcode_subset <- zipcode_data[zipcode_data$zipcode_numbers < 3000, , drop = FALSE]

zipcode_subset$numeric_value <- sample(1:100, size = nrow(zipcode_subset), replace = TRUE)

p <- plotDK::plotDK(
  data = zipcode_subset,
  id = "zipcode_numbers",
  value = "numeric_value",
  plotlevel = "zipcode"
)
p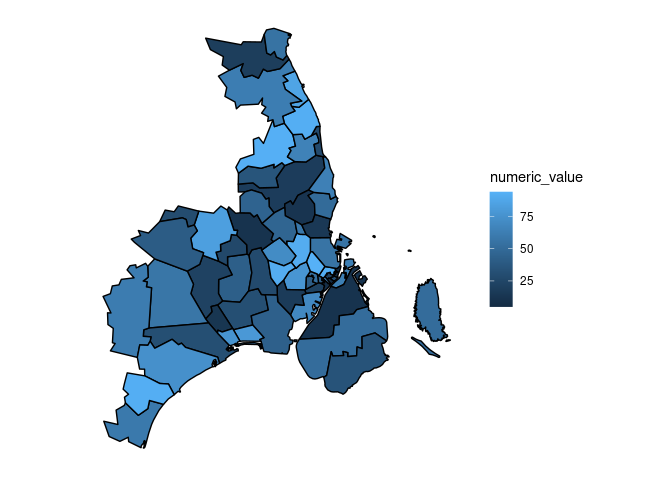
If you only have data on a subset of entities, but want the entire map drawn, do this by passing the argument; show_missing = TRUE:
p <- plotDK::plotDK(
  data = zipcode_subset,
  id = "zipcode_numbers",
  value = "numeric_value",
  plotlevel = "zipcode",
  show_missing = TRUE
)

p