![]()
![]()
![]()
promor is a user-friendly, comprehensive R package
that combines proteomics data analysis with machine learning-based
modeling.
promor streamlines differential expression analysis
of label-free quantification (LFQ) proteomics data and
building predictive models with top protein candidates.
With promor we provide a range of quality control
and visualization tools to analyze label-free proteomics data at the
protein level.
Input files for promor are a proteinGroups.txt
file produced by MaxQuant or a standard
input file containing a quantitative matrix of protein intensities
and an expDesign.txt
file containing the experimental design of your proteomics
data.
The standard input file should be a tab-delimited text file. Proteins or protein groups should be indicated by rows and samples by columns. Protein names should be listed in the first column and you may use a column name of your choice for the first column. The remaining sample column names should match the sample names indicated by the mq_label column in the expDesign.txt file.
:rotating_light:Check out our R Shiny app: PROMOR App
Install the released version from CRAN
install.packages("promor")Install development version from GitHub
# install devtools, if you haven't already:
install.packages("devtools")

# install promor from github
devtools::install_github("caranathunge/promor")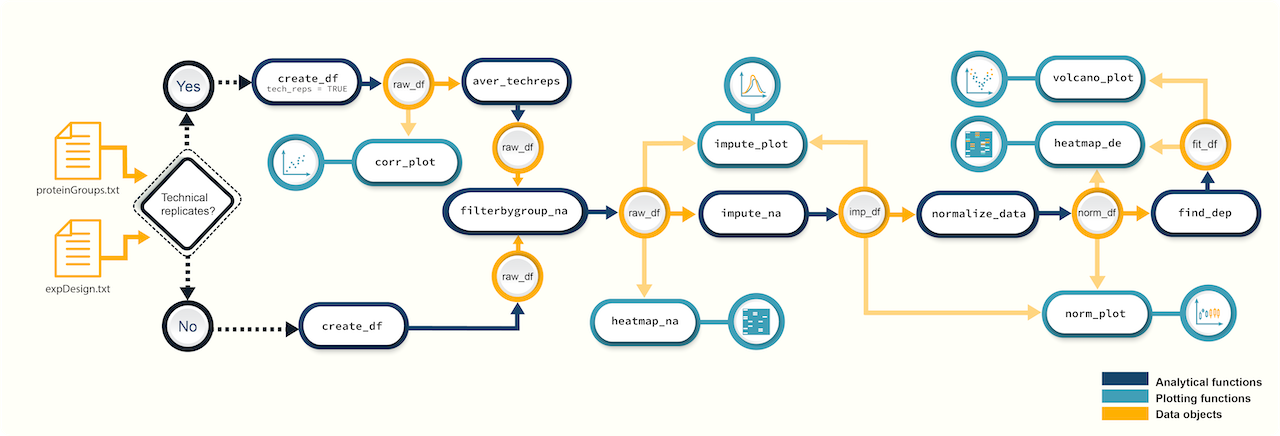 Figure 1. A
schematic diagram of suggested workflows for proteomics data analysis
with promor.
Figure 1. A
schematic diagram of suggested workflows for proteomics data analysis
with promor.
Here is a minimal working example showing how to identify
differentially expressed proteins between two conditions using
promor in five simple steps. We use a previously published
data set from Cox et
al. (2014) (PRIDE ID: PXD000279).
# Load promor
library(promor)

# Create a raw_df object with the files provided in this github account.
raw <- create_df(
  prot_groups = "https://raw.githubusercontent.com/caranathunge/promor_example_data/main/pg1.txt",
  exp_design = "https://raw.githubusercontent.com/caranathunge/promor_example_data/main/ed1.txt"
)

# Filter out proteins with high levels of missing data in either condition or group
raw_filtered <- filterbygroup_na(raw)

# Impute missing data and create an imp_df object.
imp_df <- impute_na(raw_filtered)

# Normalize data and create a norm_df object
norm_df <- normalize_data(imp_df)

# Perform differential expression analysis and create a fit_df object
fit_df <- find_dep(norm_df)
Lets take a look at the results using a volcano plot.
volcano_plot(fit_df, text_size = 5)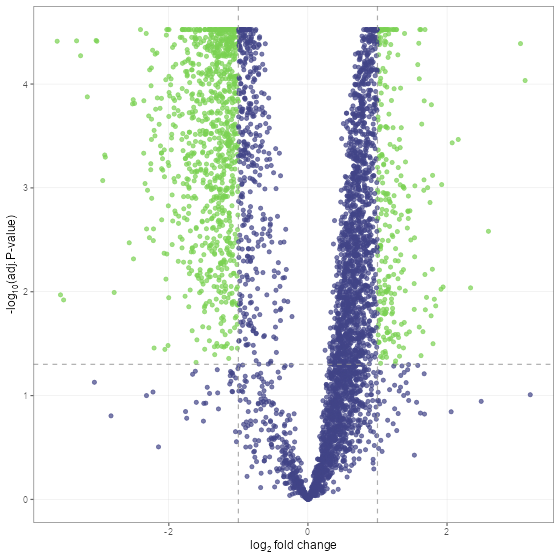
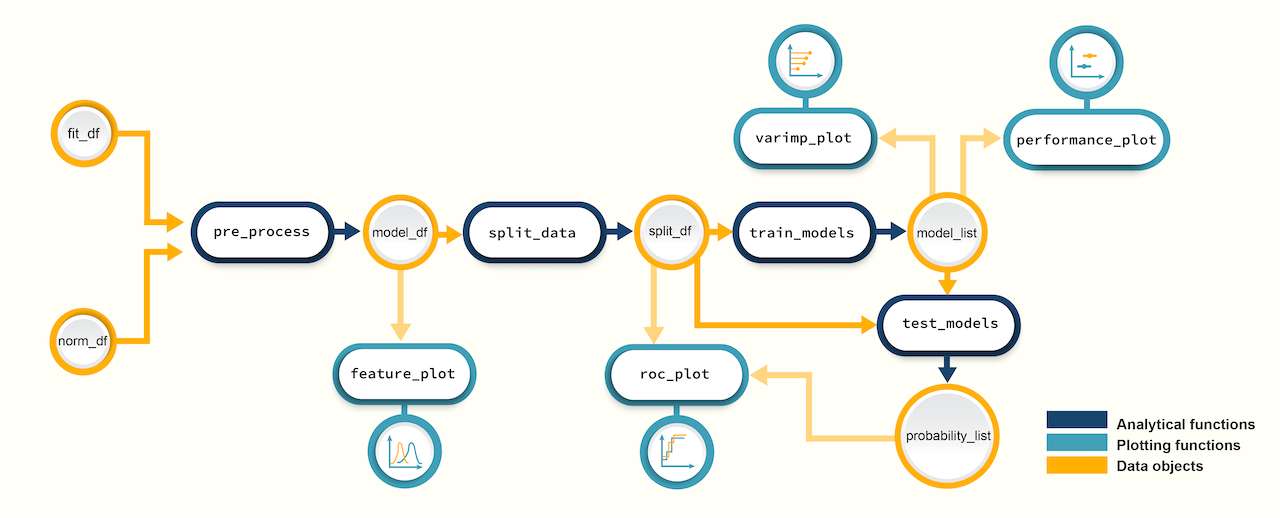 Figure 2. A schematic diagram of suggested workflows for building
predictive models with promor.
Figure 2. A schematic diagram of suggested workflows for building
predictive models with promor.
The following minimal working example shows you how to use your
results from differential expression analysis to build machine
learning-based predictive models using promor.
We use a previously published data set from Suvarna et al. (2021) that used differentially expressed proteins between severe and non-severe COVID patients to build models to predict COVID severity.
# First, let's make a model_df object of top differentially expressed proteins.
# We will be using example fit_df and norm_df objects provided with the package.
covid_model_df <- pre_process(
fit_df = covid_fit_df,
norm_df = covid_norm_df
)
# Next, we split the data into training and test data sets
covid_split_df <- split_data(model_df = covid_model_df)
# Let's train our models using the default list of machine learning algorithms
covid_model_list <- train_models(split_df = covid_split_df)
# We can now use our models to predict the test data
covid_prob_list <- test_models(
model_list = covid_model_list,
split_df = covid_split_df
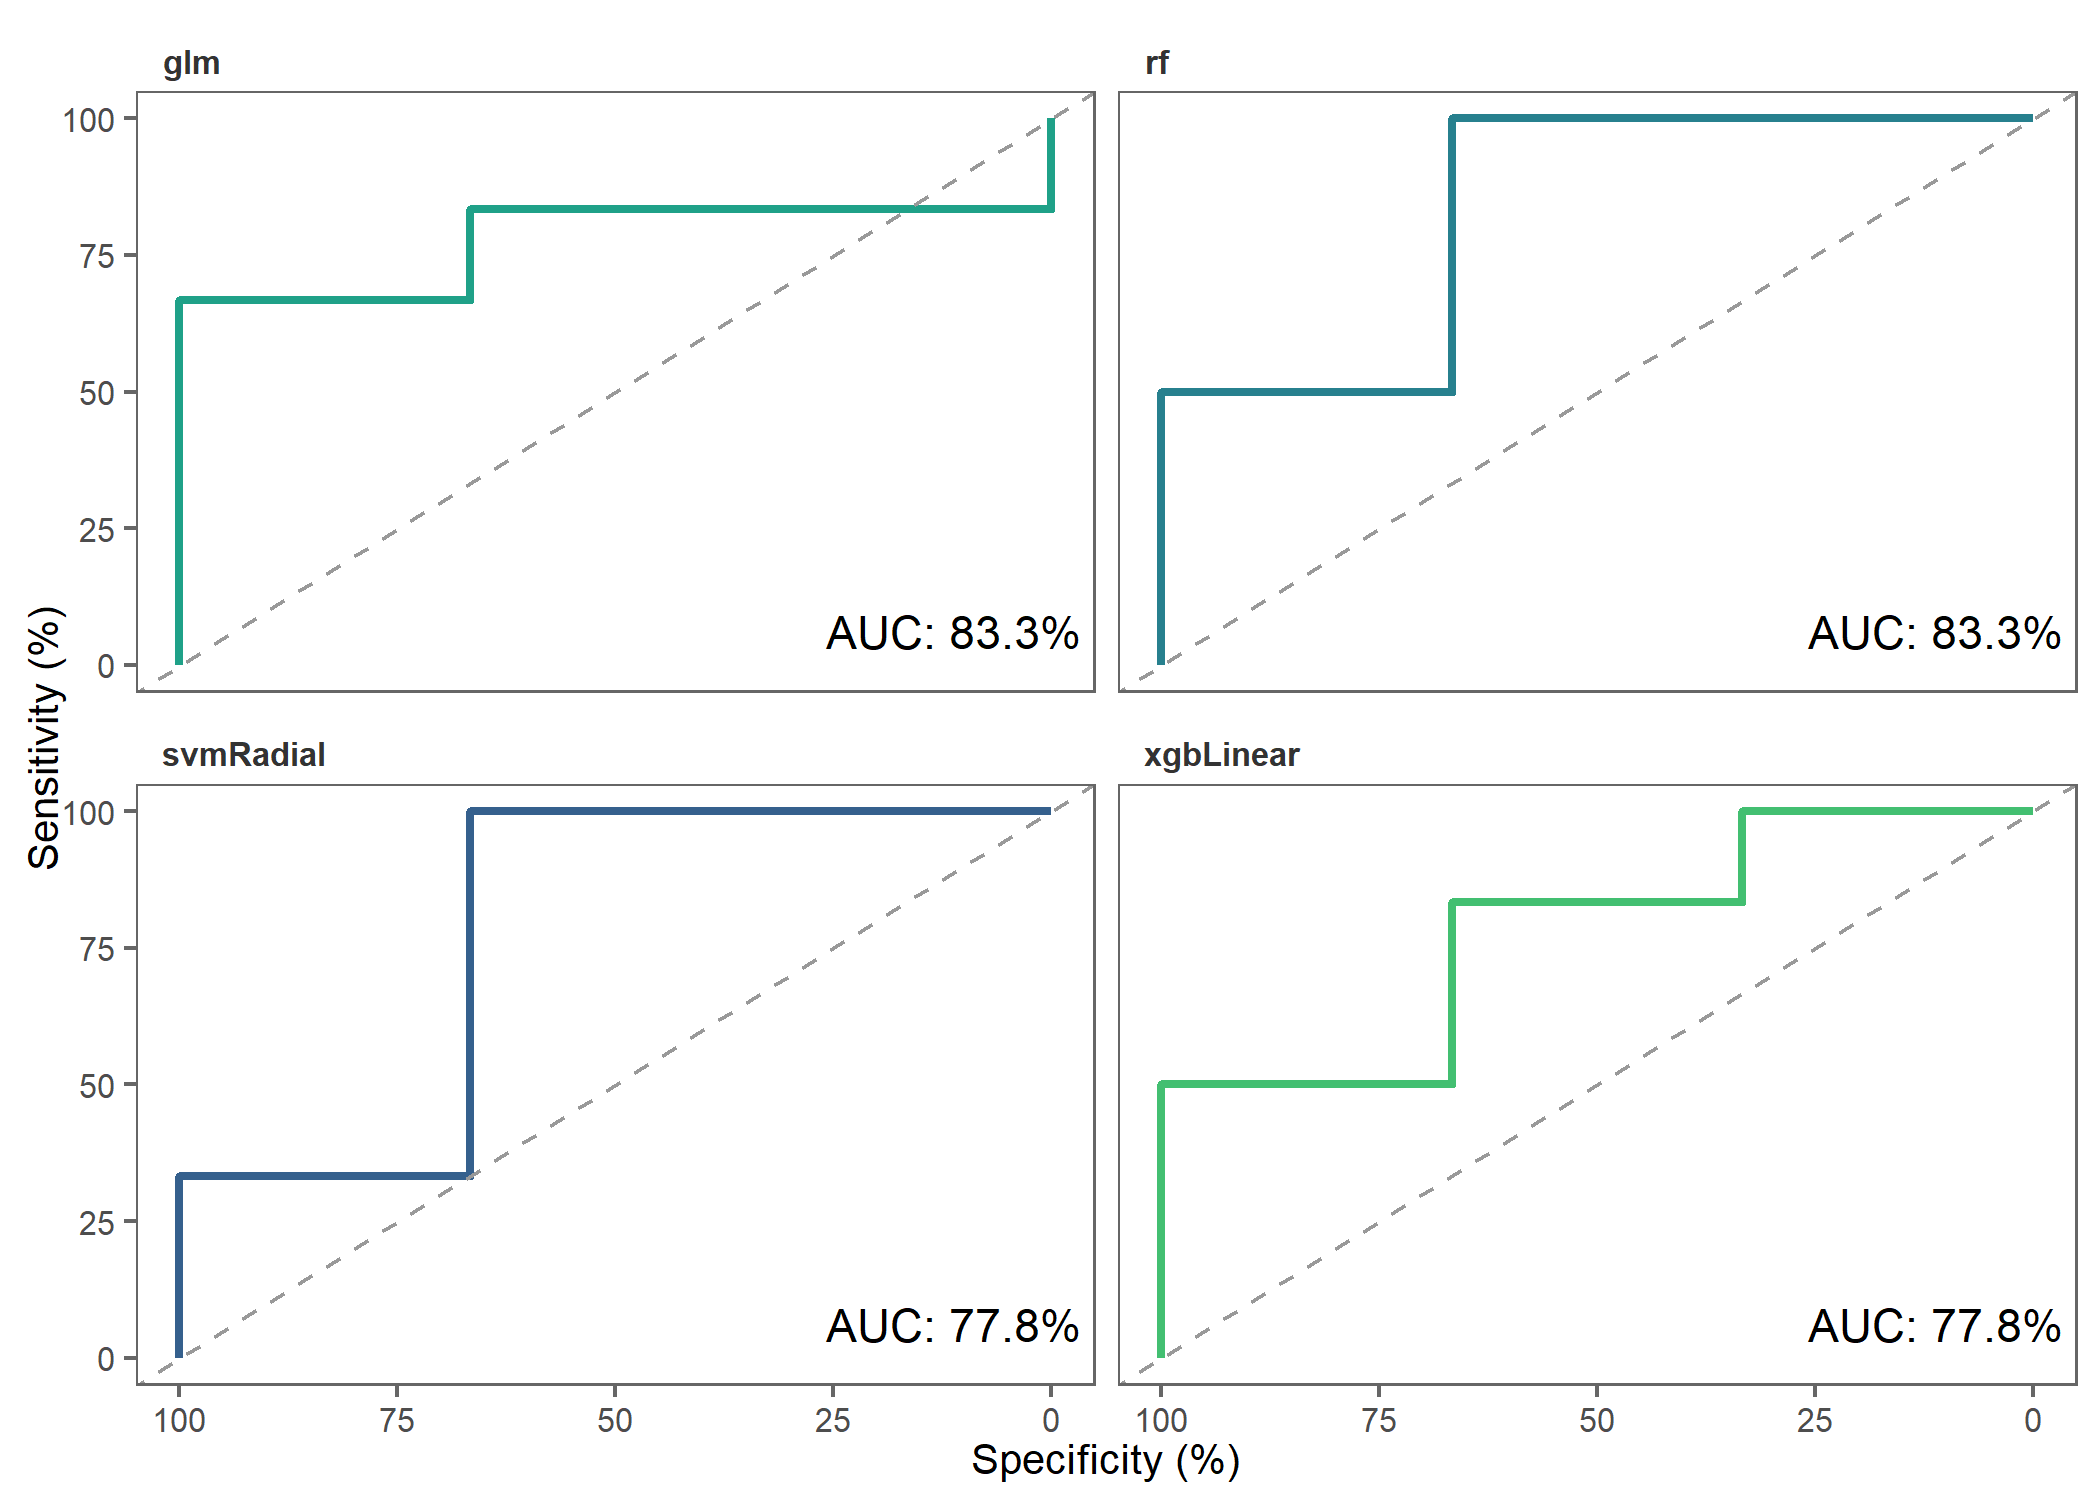
)Let’s make ROC plots to check how the different models performed.
roc_plot(
  probability_list = covid_prob_list,
  split_df = covid_split_df
)
You can choose a tutorial from the list below that best fits your experiment and the structure of your proteomics data.
vignette("intro_to_promor", package = "promor")If your data do NOT contain technical replicates: promor: No technical replicates
If your data contain technical replicates: promor: Technical replicates
If you would like to use your proteomics data to build predictive models: promor: Modeling