

![]()
Seriation arranges a set of objects into a linear order given available data with the goal of revealing structural information. This package provides the infrastructure for ordering objects with an implementation of many seriation/ordination techniques to reorder data matrices, dissimilarity matrices, correlation matrices, and dendrograms (see below for a complete list). The package provides several visualizations (grid and ggplot2) to reveal structural information, including permuted image plots, reordered heatmaps, Bertin plots, clustering visualizations like dissimilarity plots, and visual assessment of cluster tendency plots (VAT and iVAT).
Here are some quick guides on applications of seriation:
Implemented seriation methods and criteria:
The following R packages use seriation: adepro, arulesViz, baizer, ChemoSpec, corrgram, corrplot, corrr, dendextend, DendSer, dendsort, disclapmix, elaborator, flexclust, GAPR, ggraph, heatmaply, MEDseq, ockc, protti, RMaCzek, SFS, tidygraph, treeheatr, vcdExtra
To cite package ‘seriation’ in publications use:
Hahsler M, Hornik K, Buchta C (2008). “Getting things in order: An introduction to the R package seriation.” Journal of Statistical Software, 25(3), 1-34. ISSN 1548-7660, doi:10.18637/jss.v025.i03 https://doi.org/10.18637/jss.v025.i03.
@Article{,
  title = {Getting things in order:  An introduction to the R package seriation},
  author = {Michael Hahsler and Kurt Hornik and Christian Buchta},
  year = {2008},
  journal = {Journal of Statistical Software},
  volume = {25},
  number = {3},
  pages = {1--34},
  doi = {10.18637/jss.v025.i03},
  month = {March},
  issn = {1548-7660},
}Seriation methods for dissimilarity data reorder the set of objects in the data. The methods fall into several groups based on the criteria they try to optimize, constraints (like dendrograms), and the algorithmic approach.
These methods create a dendrogram using hierarchical clustering and then derive the seriation order from the leaf order in the dendrogram. Leaf reordering may be applied.
Find a seriation order by reducing the dimensionality to 1 dimension. This is typically done by minimizing a stress measure or the reconstruction error.
These methods try to optimize a seriation criterion directly, typically using a heuristic approach.
A detailed comparison of the most popular methods is available in the paper An experimental comparison of seriation methods for one-mode two-way data. (read the preprint).
For matrices, rows and columns are reordered.
Row and column order influence each other.
These methods need access to the data matrix instead of dissimilarities to reorder objects (rows). The same approach can be applied to columns.
Stable CRAN version: Install from within R with
install.packages("seriation")Current development version: Install from r-universe.
install.packages("seriation",
    repos = c("https://mhahsler.r-universe.dev",
"https://cloud.r-project.org/"))The used example dataset contains the joint probability of disagreement between Supreme Court Judges from 1995 to 2002. The goal is to reveal structural information in this data. We load the library, read the data, convert the data to a distance matrix, and then use the default seriation method to reorder the objects.
library(seriation)
data("SupremeCourt")

d <- as.dist(SupremeCourt)
d
## Breyer Ginsburg Kennedy OConnor Rehnquist Scalia Souter Stevens
## Ginsburg 0.120
## Kennedy 0.250 0.267
## OConnor 0.209 0.252 0.156
## Rehnquist 0.299 0.308 0.122 0.162
## Scalia 0.353 0.370 0.188 0.207 0.143
## Souter 0.118 0.096 0.248 0.220 0.293 0.338
## Stevens 0.162 0.145 0.327 0.329 0.402 0.438 0.169
## Thomas 0.359 0.368 0.177 0.205 0.137 0.066 0.331 0.436order <- seriate(d)
order## object of class 'ser_permutation', 'list'
## contains permutation vectors for 1-mode data
##
## vector length seriation method
## 1 9 SpectralHere is the resulting permutation vector.
get_order(order)## Scalia Thomas Rehnquist Kennedy OConnor Souter Breyer Ginsburg
## 6 9 5 3 4 7 1 2
## Stevens
## 8Next, we visualize the original and permuted distance matrix.
pimage(d, main = "Judges (original alphabetical order)")
pimage(d, order, main = "Judges (reordered by seriation)")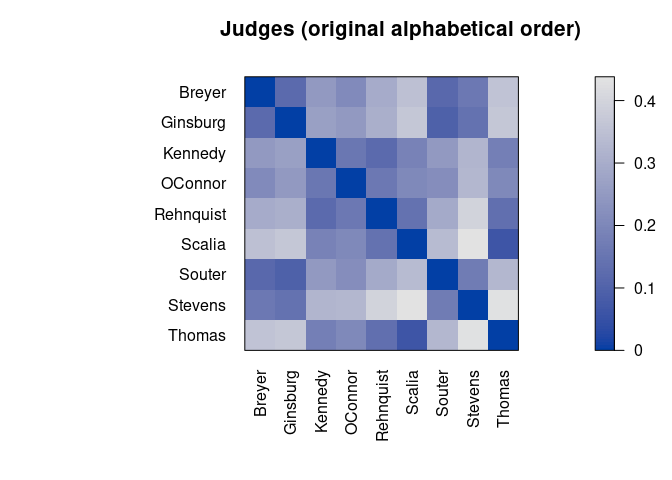
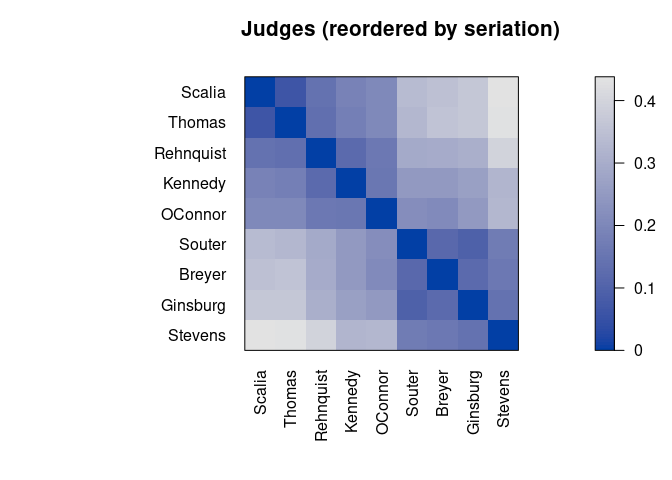
Darker squares around the main diagonal indicate groups of similar objects. After seriation, two groups are visible.
We can compare the available seriation criteria. Seriation improves all measures. Note that some measures are merit measures while others represent cost. See the manual page for details.
rbind(alphabetical = criterion(d), seriated = criterion(d, order))## 2SUM AR_deviations AR_events BAR Gradient_raw Gradient_weighted
## alphabetical 872 10.304 80 1.8 8 0.54
## seriated 811 0.064 5 1.1 158 19.76
## Inertia Lazy_path_length Least_squares LS MDS_stress ME
## alphabetical 267 6.9 967 99 0.62 99
## seriated 364 4.6 942 86 0.17 101
## Moore_stress Neumann_stress Path_length RGAR Rho
## alphabetical 7.0 3.9 1.8 0.48 0.028
## seriated 2.5 1.3 1.1 0.03 0.913Some seriation methods also return a linear configuration where more similar objects are located closer to each other.
get_config(order)## Breyer Ginsburg Kennedy OConnor Rehnquist Scalia Souter Stevens
## 0.24 0.28 -0.15 -0.11 -0.27 -0.42 0.21 0.61
## Thomas
## -0.41plot_config(order)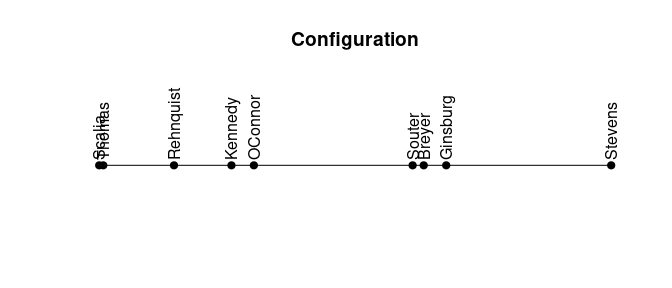
We can see a clear divide between the two groups in the configuration.