![]()
Sudden gains are large and stable improvements in an outcome variable
between consecutive measurements, for example during a psychological
intervention with multiple assessments (Tang and DeRubeis, 1999). The R
package suddengains provides a set of tools to facilitate
sudden gains research. It identifies sudden gains or sudden losses while
allowing to apply adaptations of the standard criteria. It handles
multiple gains by creating two datasets, one structured by sudden gains
and one by participants. It also implements a function to specify which
sudden gains to choose in case of multiple gains (e.g. the earliest or
largest gain).
An interactive web application shinygains
illustrates the main functions of this package and allows users to
explore and understand the impact of different methodological
choices.
To learn more about the background of this package see our paper in PLOS ONE. We have also created an open Zotero group collecting all the literature looking at sudden gains in psychological therapies. Please let me know if I missed anything or join the group and add papers yourself.
You can install the released version of suddengains from CRAN with:
install.packages("suddengains")And the development version from GitHub with:
# install.packages("devtools")
devtools::install_github("milanwiedemann/suddengains")The suddengains package comes with a range of features
which can be categorised into:
select_cases(): Select sample providing enough data to
identify sudden gainsdefine_crit1_cutoff(): Uses RCI formula to determine a
cut-off value for criterion 1identify_sg(): Identifies sudden gainsidentify_sl(): Identifies sudden lossescheck_interval(): Checks if a given interval is a
sudden gain/lossextract_values(): Extracts values on a secondary
measure around the sudden gain/losscreate_bysg(): Creates a dataset with one row for each
personcreate_byperson(): Creates a dataset with one row for
each sudden gain/losswrite_bysg(): Exports CSV, SPSS, Excel, or STATA files
of the sudden gains data setswrite_byperson(): Exports CSV, SPSS, Excel, or STATA
files of the sudden gains data setscount_intervals(): Count number of between-session
intervals available to identify sudden gainsplot_sg(): Creates plots of the average sudden
gainplot_sg_trajectories(): Creates plots of plots of
individual case trajectoriesplot_sg_intervals(): Plot summary of available data per
time point and analysed session to session intervalsdescribe_sg(): Shows descriptives for the sudden gains
datasetsselect_cases(): Select sample providing enough data to
identify sudden gainsdefine_crit1_cutoff(): Define cut-off value for first
SG criterionrename_sg_vars(): Rename variable names to a generic
and consistent formatA detailed illustration of all functions can be found in the vignette on CRAN. Note that the vignette is only available in R when you install the package from CRAN.
suddengainsHere are a few examples how to use the suddengains
package.
# Load the package
library(suddengains)
#>
#> ── This is suddengains 0.7.0 ───────────────────────────────────────────────────
#> ℹ Please report any issues or ideas at:
#> ℹ https://github.com/milanwiedemann/suddengains/issues
#>
Below are some examples illustrating the suddengains package. More details can be found in the Vignette or in our PLOS ONE paper.
To identify sudden gains/losses you can use the
identify_sg() and
identify_sl() functions. These functions
return a data frame with new variables indicating for each
between-session interval whether a sudden gain/loss was identified. For
example the variable sg_2to3 holds information whether a
sudden gains occurred from session two to three, with two being the
pregain and three being the postgain session. Further functions to help
with identifying sudden gains are listed above.
identify_sg(data = sgdata,
            sg_crit1_cutoff = 7,
            sg_crit2_pct = 0.25,
            sg_crit3 = TRUE,
            id_var_name = "id",
            sg_var_list = c("bdi_s1", "bdi_s2", "bdi_s3", "bdi_s4",
                            "bdi_s5", "bdi_s6", "bdi_s7", "bdi_s8",
                            "bdi_s9", "bdi_s10", "bdi_s11", "bdi_s12"),
identify_sg_1to2 = FALSE)As participants may experience more than one gain, as in the present
example, and to allow for different subsequent analyses, the package
provides two options for output datasets: The
create_bysg() function creates a dataset
structured with one row per sudden gain, and the
create_byperson() function creates a
dataset structured with one row per person, indicating whether or not
they experienced a sudden gain. The
create_bysg() function is shown below.
More functions to help with creating datasets for further analyses are
listed above.
# Create output dataset with one row per sudden gain
# and save as an object called "bysg" to use later
bysg <- create_bysg(data = sgdata,
                    sg_crit1_cutoff = 7,
                    id_var_name = "id",
                    tx_start_var_name = "bdi_s1",
                    tx_end_var_name = "bdi_s12",
                    sg_var_list = c("bdi_s1", "bdi_s2", "bdi_s3", "bdi_s4",
                                    "bdi_s5", "bdi_s6", "bdi_s7", "bdi_s8",
                                    "bdi_s9", "bdi_s10", "bdi_s11", "bdi_s12"),
                    sg_measure_name = "bdi",
                    identify = "sg")
#> First, second, and third sudden gains criteria were applied.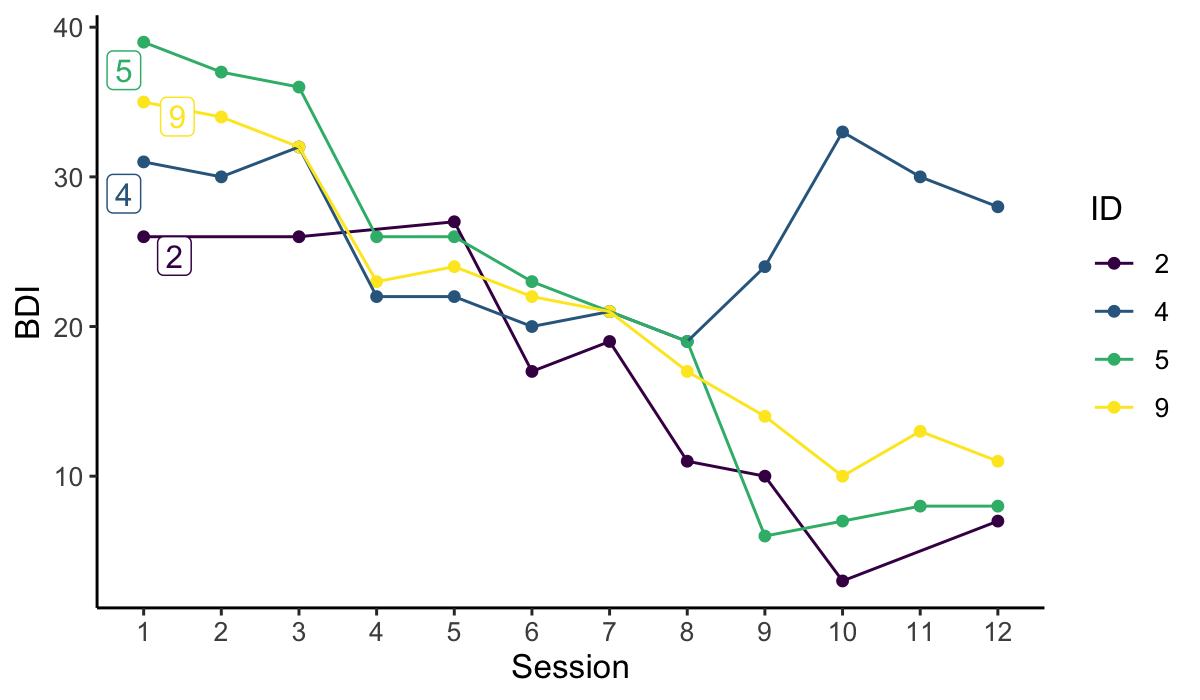
#> The critical value for the third criterion was adjusted for missingness.The plot_sg() function plots the
‘average’ sudden gain, and can be used to show changes around the sudden
gain. The plot_sg_trajectories() can be
used to visualise trajectories for a selection of individual cases.
# Create plot of average change in depression symptoms (BDI) around the gain
plot_sg(data = bysg,
        id_var_name = "id",
        tx_start_var_name = "bdi_s1",
        tx_end_var_name = "bdi_s12",
        sg_pre_post_var_list = c("sg_bdi_2n", "sg_bdi_1n", "sg_bdi_n",
                                 "sg_bdi_n1", "sg_bdi_n2", "sg_bdi_n3"),
        ylab = "BDI", xlab = "Session",
        colour_single = "#239b89ff")
#> Warning: Removed 27 rows containing non-finite values (`stat_summary()`).
#> Removed 27 rows containing non-finite values (`stat_summary()`).
#> Warning: Removed 14 rows containing non-finite values (`stat_summary()`).
#> Warning: Removed 8 rows containing non-finite values (`stat_summary()`).
#> Warning: Removed 10 rows containing non-finite values (`stat_summary()`).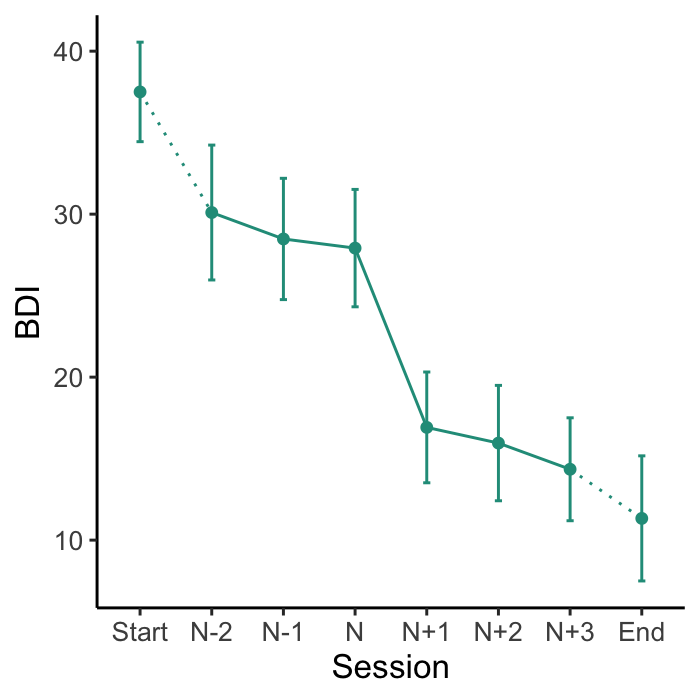
# Visualise trajectories for a selection of individual cases
plot_sg_trajectories(data = sgdata,
                     id_var = "id",
                     select_id_list = c("2", "4", "5", "9"),
                     var_list = c("bdi_s1", "bdi_s2", "bdi_s3", "bdi_s4",
                                  "bdi_s5", "bdi_s6", "bdi_s7", "bdi_s8",
                                  "bdi_s9", "bdi_s10", "bdi_s11", "bdi_s12"),
                     show_id = TRUE,
                     id_label_size = 4,
                     label.padding = .2,
                     show_legend = TRUE,
                     colour = "viridis",
                     viridis_option = "D",
                     viridis_begin = 0,
                     viridis_end = 1,
                     connect_missing = TRUE,
                     scale_x_num = TRUE,
                     scale_x_num_start = 1,
                     apaish = TRUE,
                     xlab = "Session",
                     ylab = "BDI")
#> Warning: Removed 3 rows containing missing values (`geom_point()`).
#> Warning: Removed 3 rows containing missing values (`geom_label_repel()`).