![]()
As of version 2.0.0 the MIC package has being refocused to provide
MIC-specific analysis and validation utilities. Genomics-related
functions (PATRIC download helpers, genome -> \(k\)-mer conversion, \(k\)-mer utilities, and similar) have been
ported to a new package, faLearn.
To continue using these functions, simply install and load the
faLearn package alongside MIC:
# install.packages("remotes")
remotes::install_github("agerada/faLearn")
library(faLearn)MIC is an R package for the analysis of minimum
inhibitory concentration (MIC) data. The package was designed to be
compatible with the AMR, in particular most
of the functions in MIC are designed to accept and return
AMR objects, such as mic and sir.
The primary functions in MIC are designed towards
validation studies of minimum inhibitory concentrations, however it also
can (optionally) be used to support the construction of machine learning
models that predict MIC values from genomic data.
Rcpp.XGBoost-compatible
libsvm format.install.packages("MIC")# install.packages("remotes")
remotes::install_github("agerada/MIC")Load the MIC package – it is highly recommended that
AMR is also loaded. Where possible, MIC
functions maintain compatibility with AMR objects, in
particular the mic and sir classes.
library(MIC)
#>
#> Attaching package: 'MIC'
#> The following object is masked from 'package:base':
#>
#>     table
library(AMR)
To compare two mic vectors (e.g., one from a gold
standard and one from a prediction or investigational assay), the
compare_mic function can be used. An example dataset of MIC
values is provided with the package, which will be used here.
data("example_mics")
head(example_mics)
#>      gs  test           mo  ab
#> 1 0.002 0.002 B_ESCHR_COLI GEN
#> 2 0.004 0.002 B_ESCHR_COLI GEN
#> 3     8    16 B_ESCHR_COLI GEN
#> 4 0.008 0.016 B_ESCHR_COLI GEN
#> 5    64    64 B_ESCHR_COLI GEN
#> 6  0.06  0.06 B_ESCHR_COLI GEN
The dataset contains MIC values (in mic format) for a
“test” assay, and a “gold standard” (gs) assay. We will use
compare_mic to compare the MICs and validate the “test”
assay:
val <- compare_mic(gold_standard = example_mics$gs, test = example_mics$test)
val
#> MIC validation object with 300 observations
#> Agreement type: essential
Calling summary provides the essential agreement (EA)
rates and assay bias:
summary(val)
#> MIC validation summary
#> Essential agreement: 267 (89%)
#> Bias: -7
If organisms and antimicrobials are provided,
compare_mic will also calculate and return the categorical
agreement (CA) rates, in the form of minor, major, and very major
errors:
val <- compare_mic(gold_standard = example_mics$gs, test = example_mics$test,
                   mo = example_mics$mo, ab = example_mics$ab)
val
#> MIC validation object with 300 observations
#> Agreement type: essential and categorical
#> Antibiotics: GEN, MEM, AMX
#> Organisms: B_ESCHR_COLI
This time, calling summary will provide a breakdown of
the categorical agreement rates in addition to the EA rates:
summary(val)
#> MIC validation summary
#> Antibiotic: AMX, GEN, MEM
#> Organism: B_ESCHR_COLI
#> Essential agreement: 267 (89%)
#> Resistant: 113 (37.67%)
#> Minor errors: 0 (0%)
#> Major errors: 6 (2%)
#> Very major errors: 8 (2.67%)
#> Mean bias: -7
#> N: 300
#> *Use as.data.frame() to see full summary*
Using as.data.frame allows us to continue working with
the summarised results:
head(as.data.frame(val))
#>   gold_standard  test essential_agreement  ab           mo gold_standard_sir
#> 1         0.002 0.002                TRUE GEN B_ESCHR_COLI                 S
#> 2         0.004 0.002                TRUE GEN B_ESCHR_COLI                 S
#> 3             8    16                TRUE GEN B_ESCHR_COLI                 R
#> 4         0.008 0.016                TRUE GEN B_ESCHR_COLI                 S
#> 5            64    64                TRUE GEN B_ESCHR_COLI                 R
#> 6          0.06  0.06                TRUE GEN B_ESCHR_COLI                 S
#>   test_sir error
#> 1        S  <NA>
#> 2        S  <NA>
#> 3        R  <NA>
#> 4        S  <NA>
#> 5        R  <NA>
#> 6        S  <NA>
The results of an mic_validation can be plotted in a
confusion matrix (failed essential agreements are in red):
plot(val)
The plot can also be faceted by antimicrobial:
plot(val, facet_wrap_ncol = 1)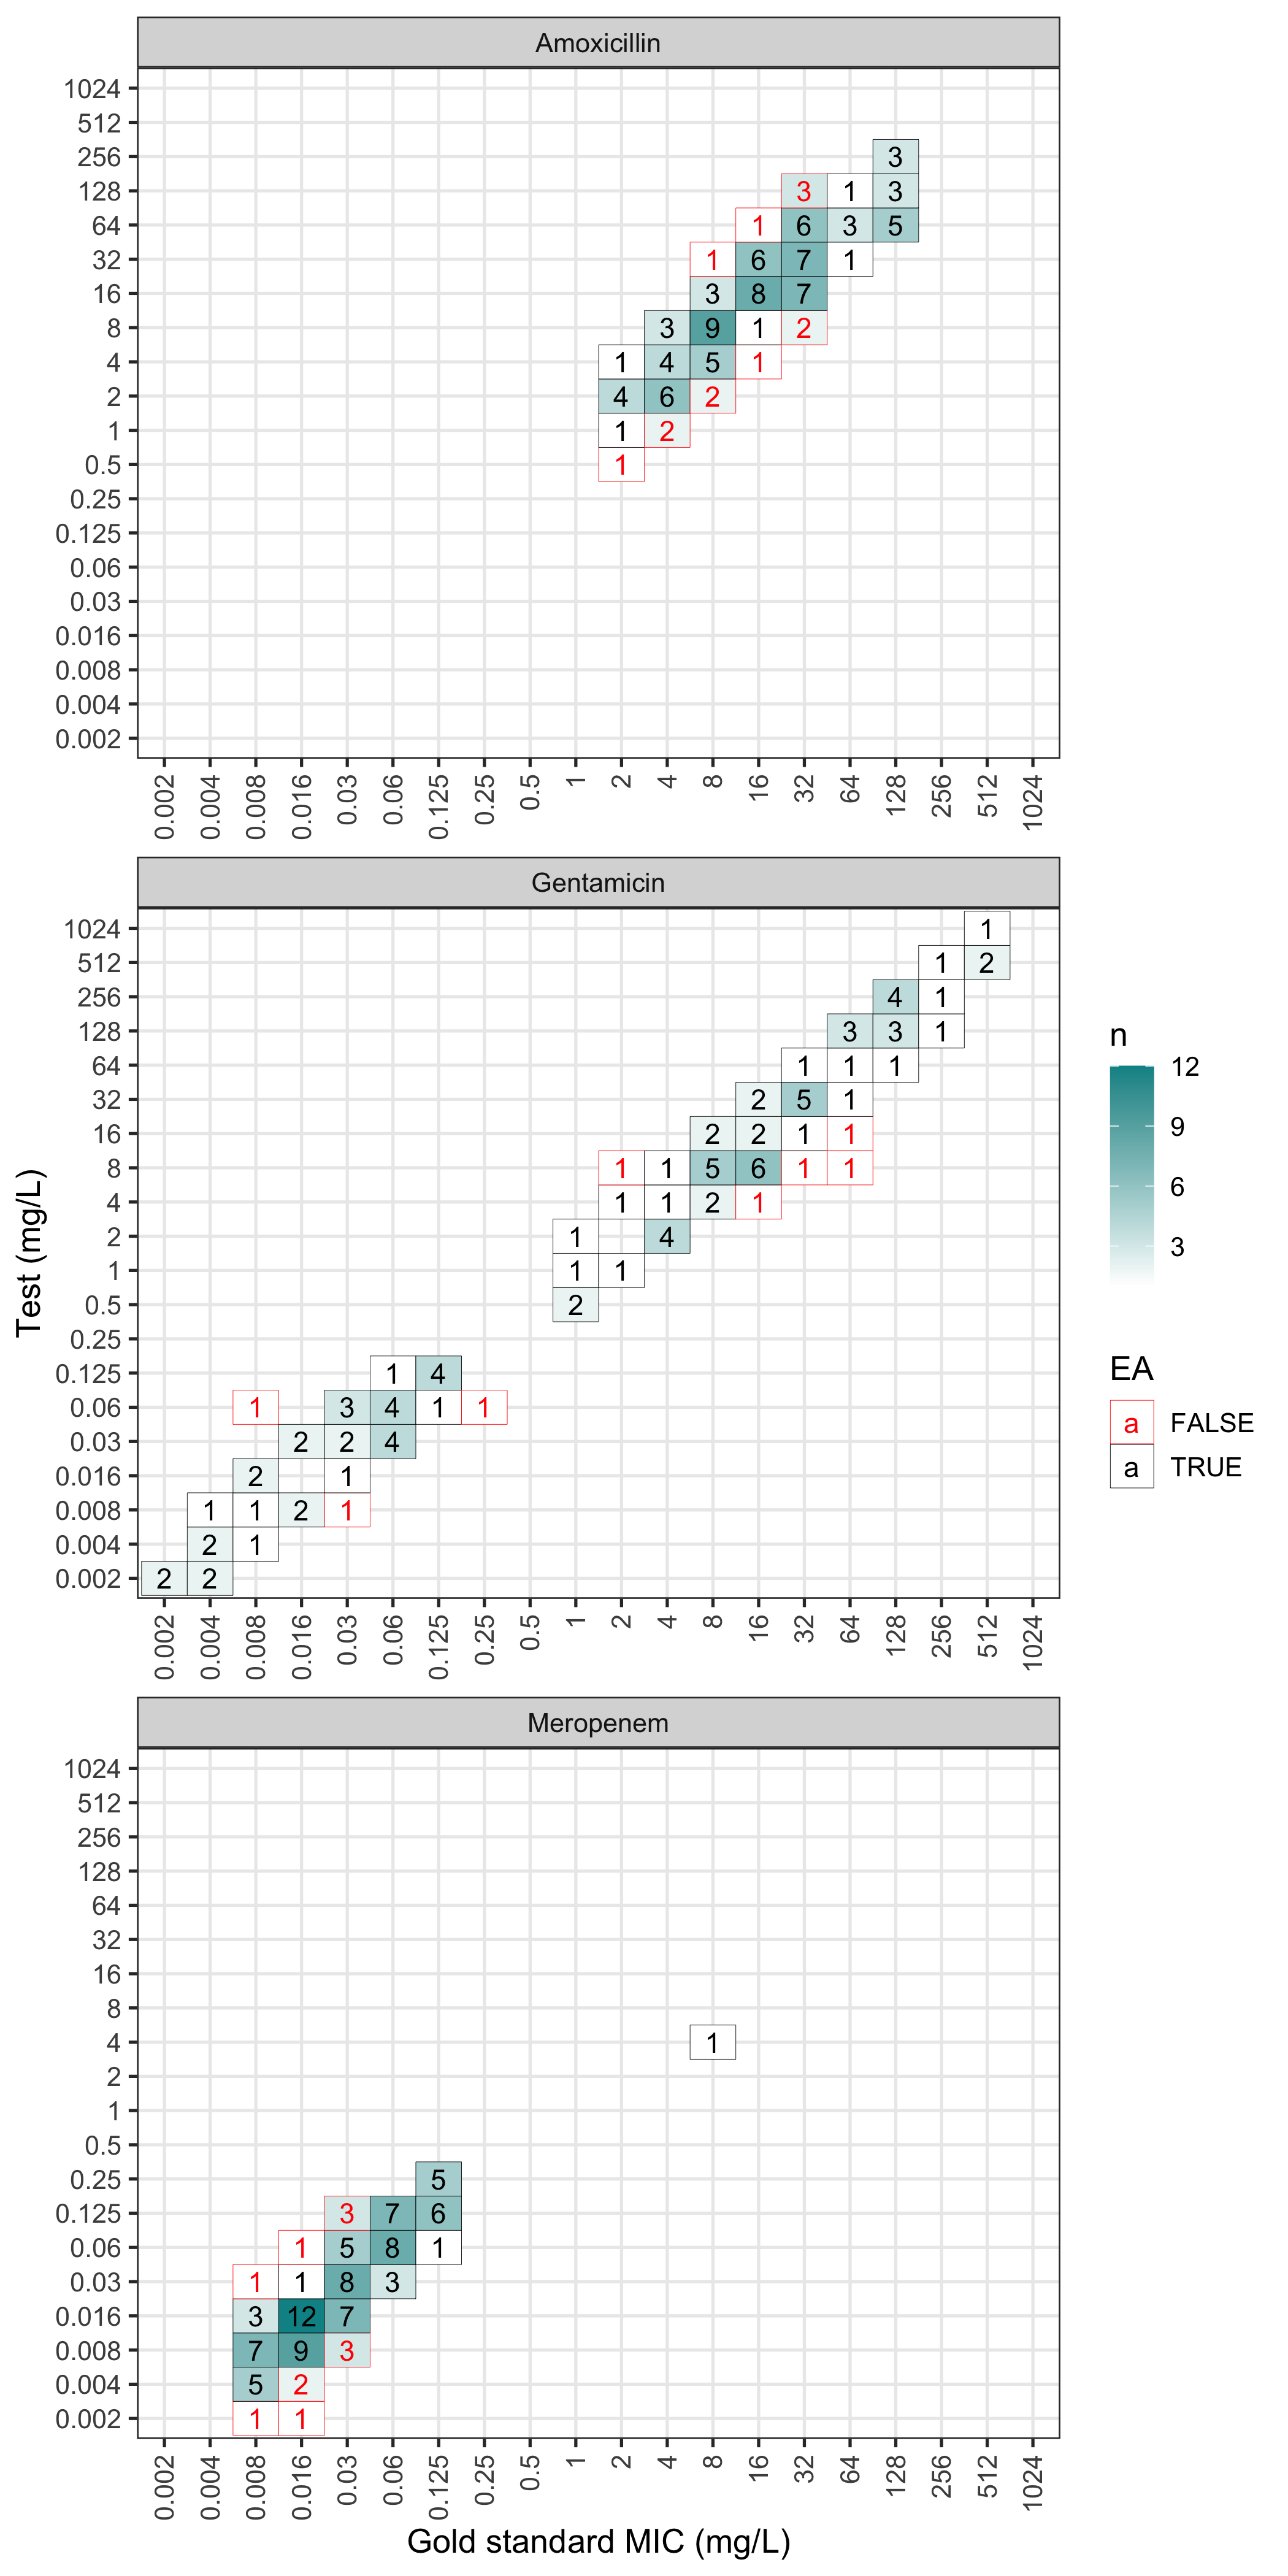
The table function can be used to generate a table of
the results:
# generate table for MEM
mem_dat <- subset(example_mics, ab == "MEM")
mem_val <- compare_mic(gold_standard = mem_dat$gs, test = mem_dat$test)
table(mem_val)